The best cities for running, November 2026
This edition analyses 1,384,252 routes across 110,741 starting points in 54 cities. Every route is evaluated using the same criteria, making it possible to compare and rank routes and cities consistently.
The best cities for running
Each city's typical run, measured using the same scoring method. The tick marks the median across all 54 cities.
- 1
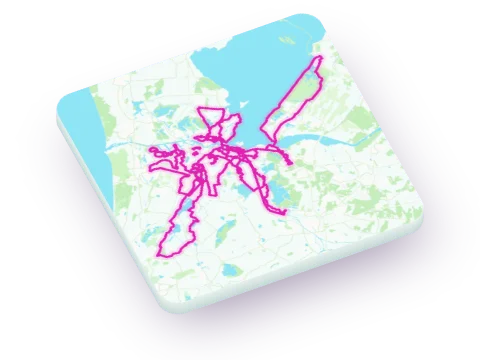 Amsterdam Typical run scores 25 out of 100 45% of what you can reach on foot is nature1,774 runs measured
- 2
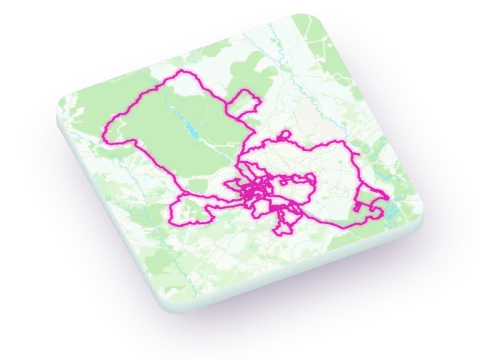 Madrid Typical run scores 22 out of 100 50% of what you can reach on foot is nature1,847 runs measured
- 3
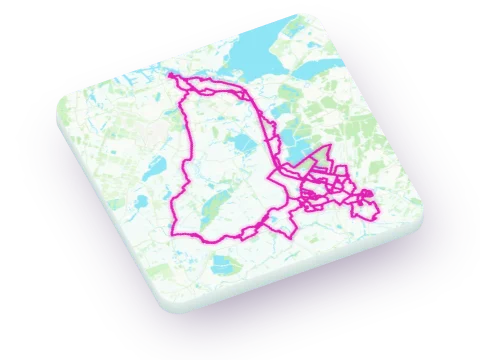 Utrecht Typical run scores 20 out of 100 39% of what you can reach on foot is nature1,849 runs measured
- 4
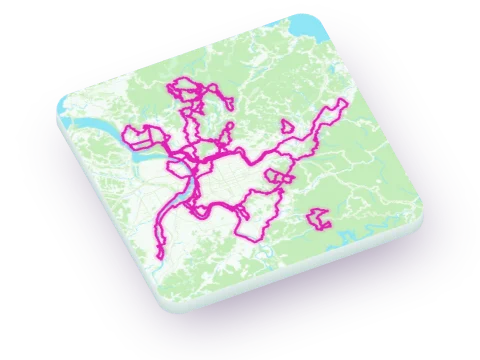 Taipei Typical run scores 20 out of 100 43% of what you can reach on foot is nature1,797 runs measured
- 5
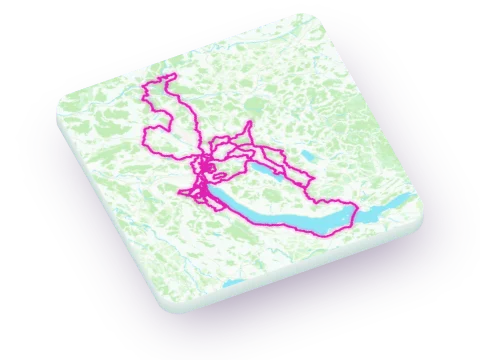 Zurich Typical run scores 20 out of 100 28% of what you can reach on foot is nature1,873 runs measured
- 6
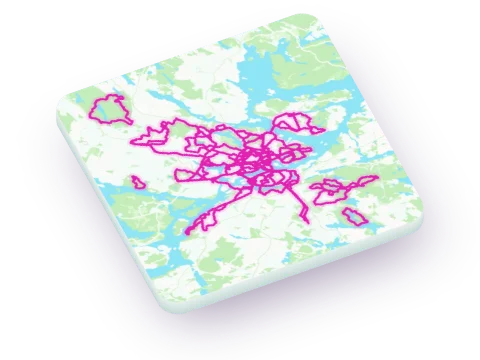 Stockholm Typical run scores 20 out of 100 27% of what you can reach on foot is nature1,816 runs measured
- 7
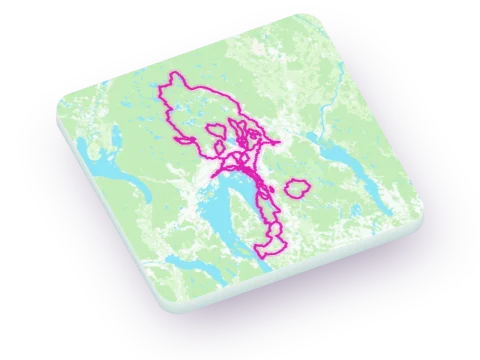 Oslo Typical run scores 20 out of 100 34% of what you can reach on foot is nature1,879 runs measured
- 8
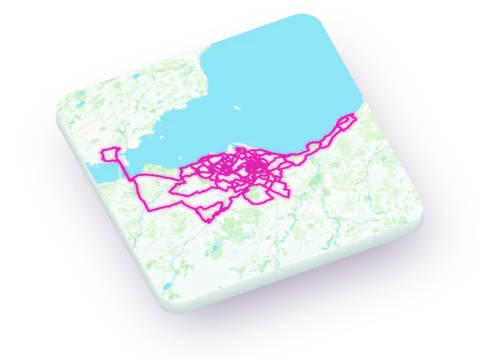 Edinburgh Typical run scores 19 out of 100 38% of what you can reach on foot is nature1,759 runs measured
- 9
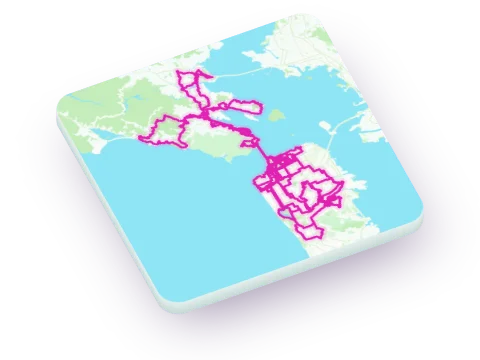 San Francisco Typical run scores 19 out of 100 31% of what you can reach on foot is nature1,803 runs measured
- 10
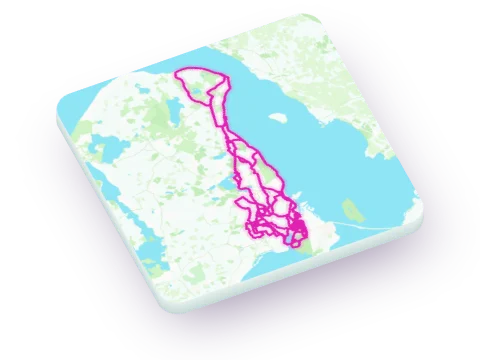 Copenhagen Typical run scores 19 out of 100 41% of what you can reach on foot is nature1,811 runs measured
- 11
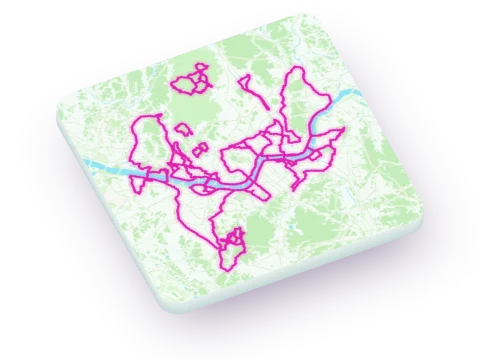 Seoul Typical run scores 17 out of 100 26% of what you can reach on foot is nature1,643 runs measured
- 12
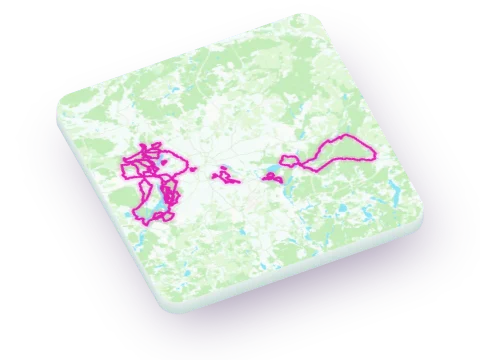 Berlin Typical run scores 17 out of 100 35% of what you can reach on foot is nature1,829 runs measured
- 13
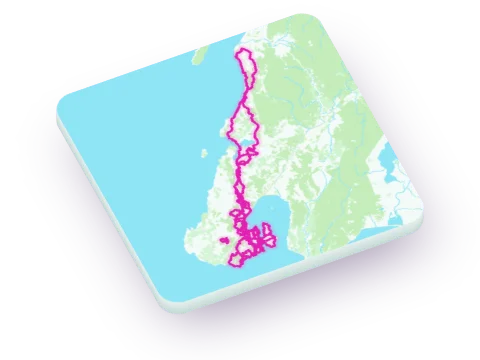 Wellington Typical run scores 17 out of 100 36% of what you can reach on foot is nature1,375 runs measured
- 14
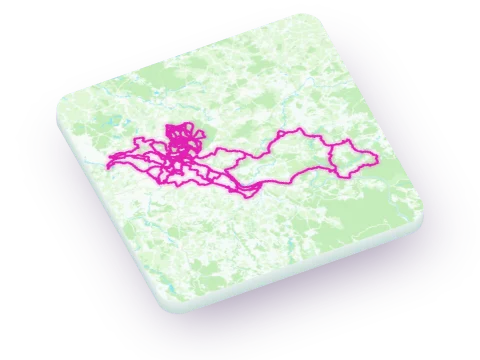 Dresden Typical run scores 17 out of 100 24% of what you can reach on foot is nature1,692 runs measured
- 15
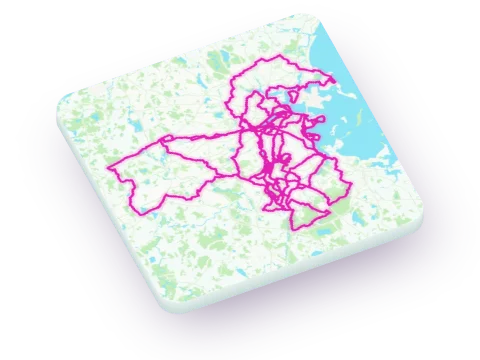 Boston Typical run scores 17 out of 100 28% of what you can reach on foot is nature1,434 runs measured
- 16
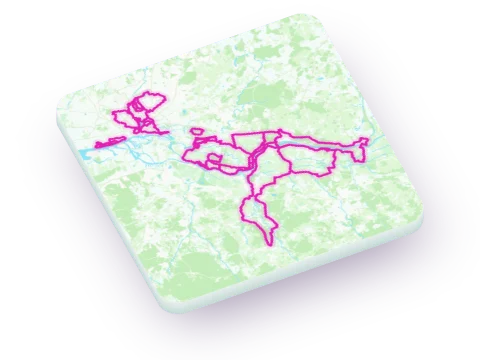 Hamburg Typical run scores 16 out of 100 29% of what you can reach on foot is nature1,680 runs measured
- 17
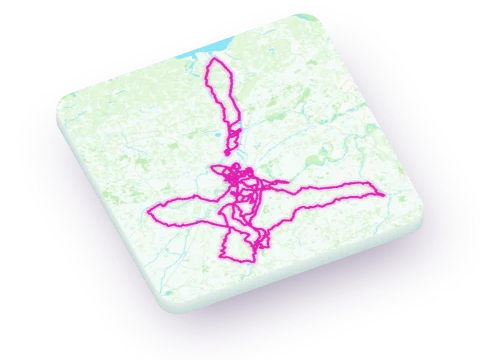 Ghent Typical run scores 16 out of 100 34% of what you can reach on foot is nature1,602 runs measured
- 18
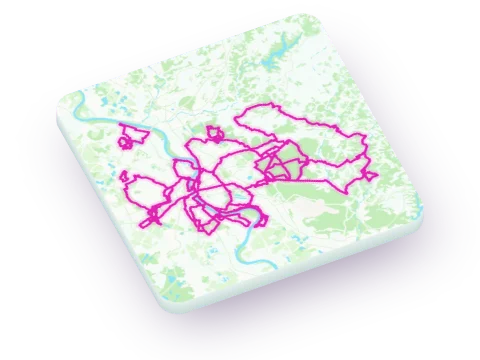 Cologne Typical run scores 16 out of 100 21% of what you can reach on foot is nature1,635 runs measured
- 19
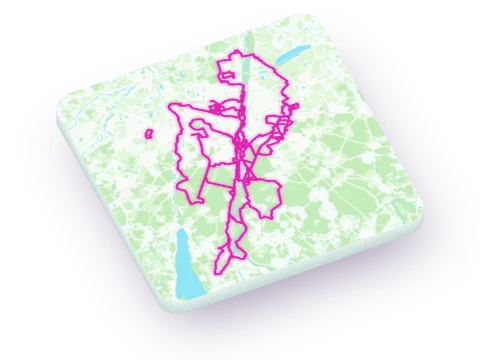 Munich Typical run scores 16 out of 100 30% of what you can reach on foot is nature1,800 runs measured
- 20
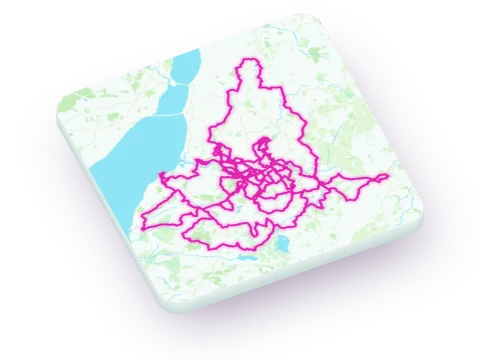 Bristol Typical run scores 16 out of 100 27% of what you can reach on foot is nature1,858 runs measured
- 21
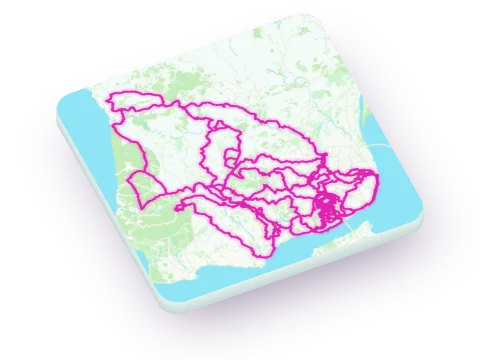 Lisbon Typical run scores 16 out of 100 32% of what you can reach on foot is nature1,841 runs measured
- 22
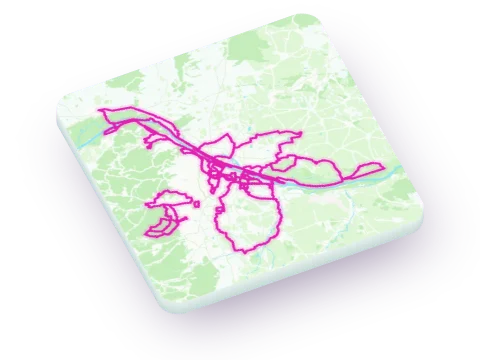 Vienna Typical run scores 15 out of 100 31% of what you can reach on foot is nature1,802 runs measured
- 23
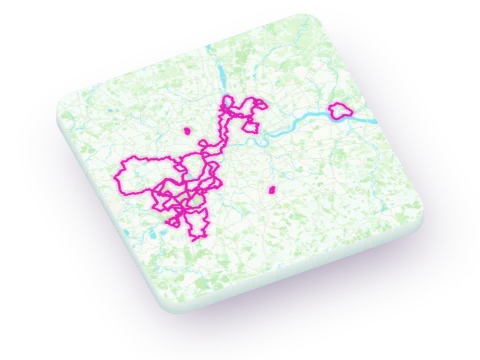 London Typical run scores 15 out of 100 27% of what you can reach on foot is nature1,705 runs measured
- 24
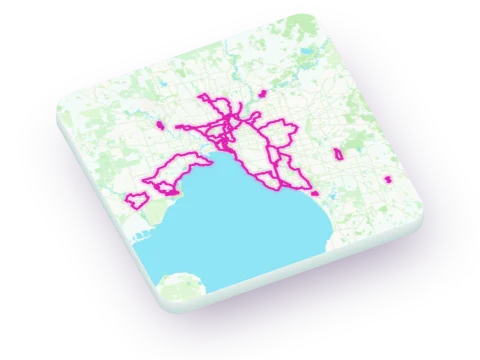 Melbourne Typical run scores 14 out of 100 30% of what you can reach on foot is nature1,441 runs measured
- 25
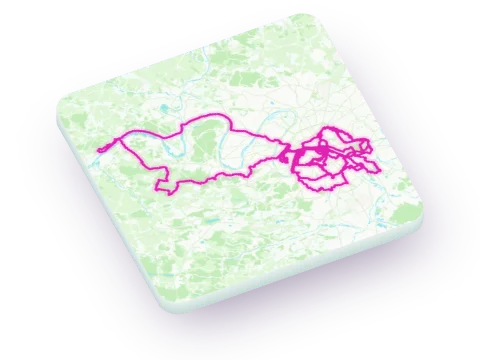 Paris Typical run scores 14 out of 100 34% of what you can reach on foot is nature2,023 runs measured
- 26
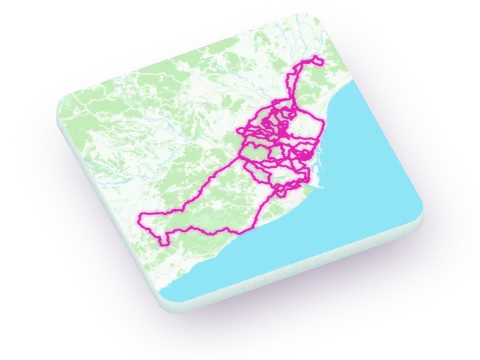 Barcelona Typical run scores 14 out of 100 39% of what you can reach on foot is nature1,958 runs measured
- 27
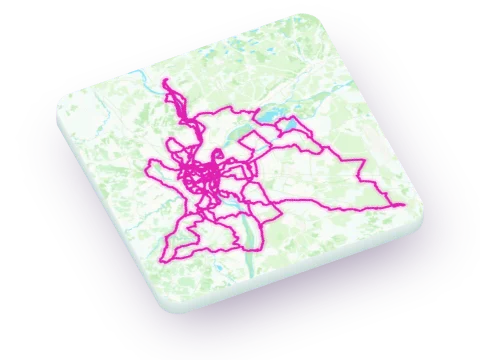 Lyon Typical run scores 14 out of 100 31% of what you can reach on foot is nature1,884 runs measured
- 28
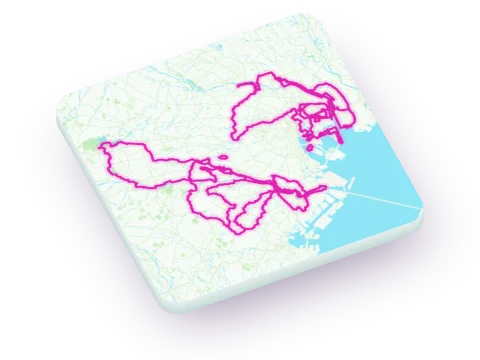 Tokyo Typical run scores 14 out of 100 20% of what you can reach on foot is nature1,790 runs measured
- 29
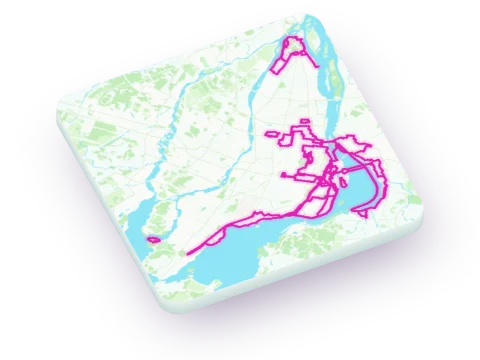 Montréal Typical run scores 13 out of 100 26% of what you can reach on foot is nature1,713 runs measured
- 30
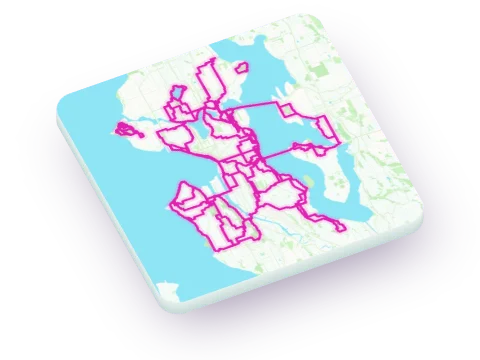 Seattle Typical run scores 13 out of 100 20% of what you can reach on foot is nature1,750 runs measured
- 31
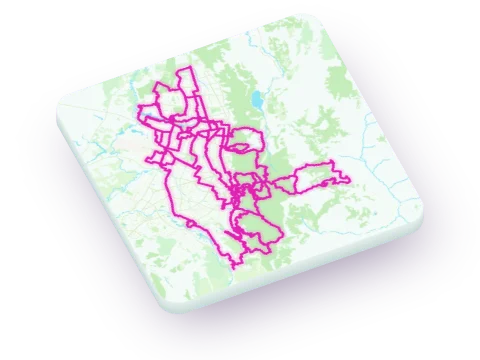 Bogotá Typical run scores 13 out of 100 31% of what you can reach on foot is nature1,625 runs measured
- 32
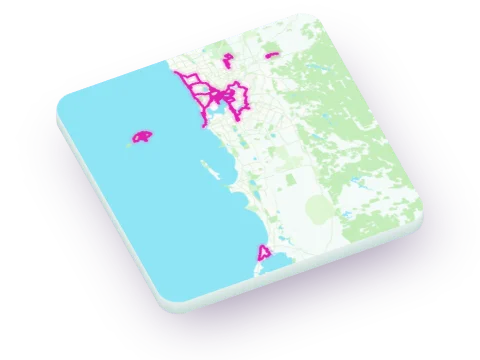 Perth Typical run scores 13 out of 100 28% of what you can reach on foot is nature1,422 runs measured
- 33
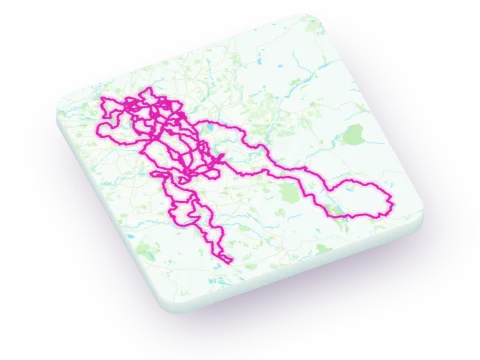 Manchester Typical run scores 13 out of 100 24% of what you can reach on foot is nature1,833 runs measured
- 34
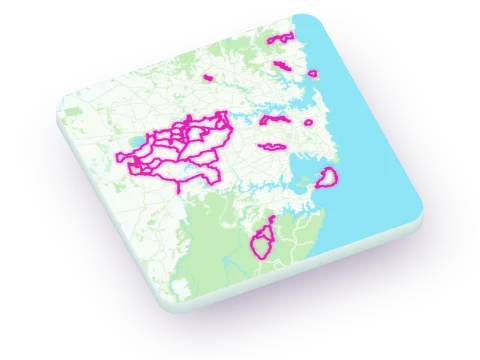 Sydney Typical run scores 12 out of 100 27% of what you can reach on foot is nature1,314 runs measured
- 35
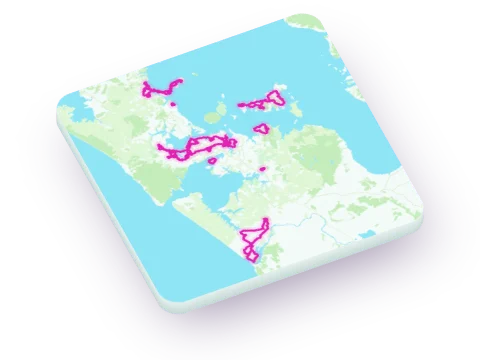 Auckland Typical run scores 12 out of 100 35% of what you can reach on foot is nature1,198 runs measured
- 36
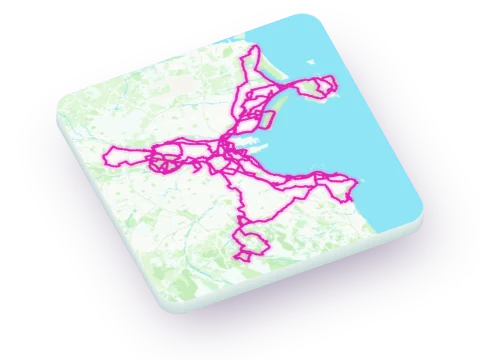 Dublin Typical run scores 12 out of 100 25% of what you can reach on foot is nature1,472 runs measured
- 37
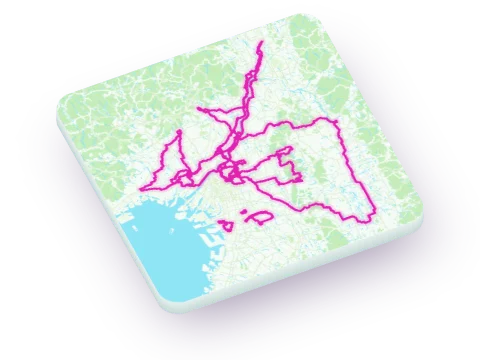 Osaka Typical run scores 12 out of 100 22% of what you can reach on foot is nature1,736 runs measured
- 38
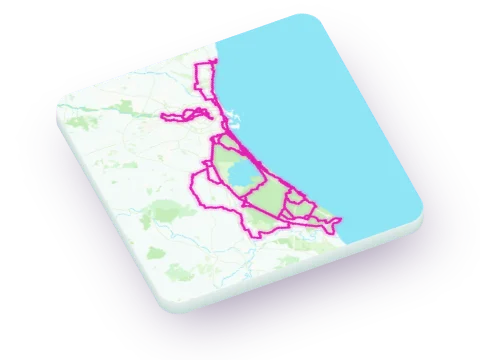 Valencia Typical run scores 12 out of 100 37% of what you can reach on foot is nature1,739 runs measured
- 39
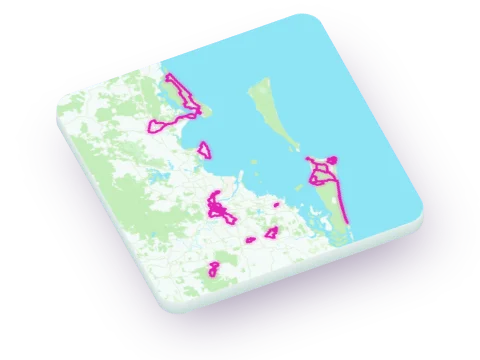 Brisbane Typical run scores 12 out of 100 27% of what you can reach on foot is nature1,175 runs measured
- 40
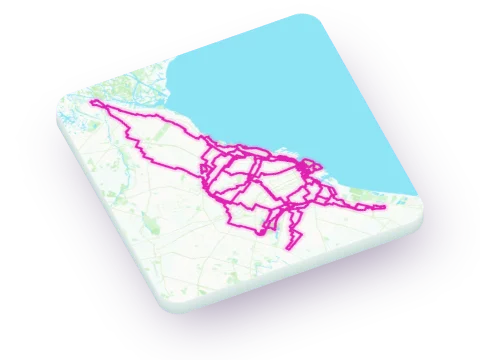 Buenos Aires Typical run scores 11 out of 100 22% of what you can reach on foot is nature1,464 runs measured
- 41
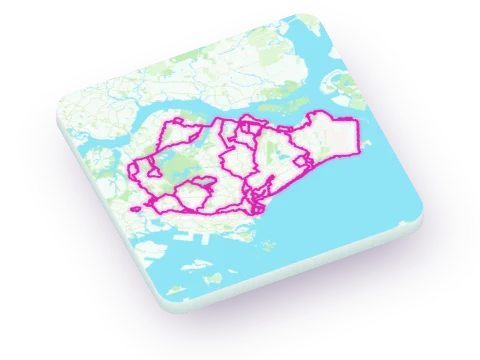 Singapore Typical run scores 11 out of 100 22% of what you can reach on foot is nature1,658 runs measured
- 42
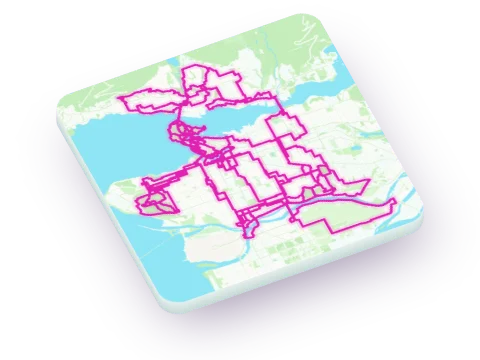 Vancouver Typical run scores 10 out of 100 19% of what you can reach on foot is nature1,812 runs measured
- 43
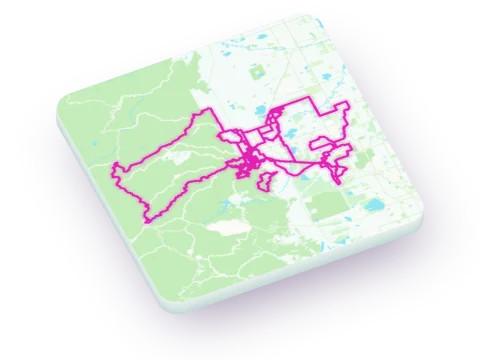 Boulder Typical run scores 10 out of 100 18% of what you can reach on foot is nature1,589 runs measured
- 44
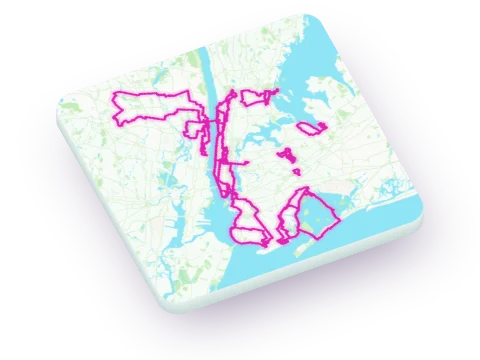 New York Typical run scores 10 out of 100 24% of what you can reach on foot is nature1,660 runs measured
- 45
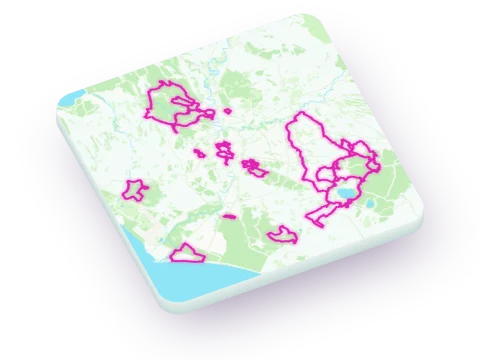 Rome Typical run scores 10 out of 100 23% of what you can reach on foot is nature1,127 runs measured
- 46
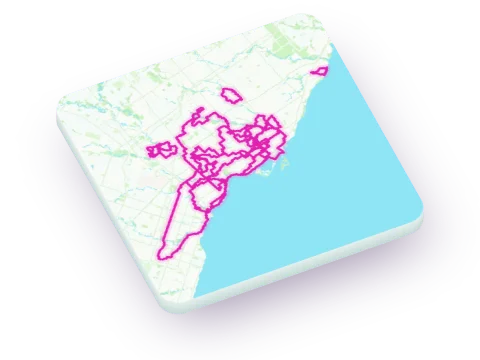 Toronto Typical run scores 9 out of 100 21% of what you can reach on foot is nature1,683 runs measured
- 47
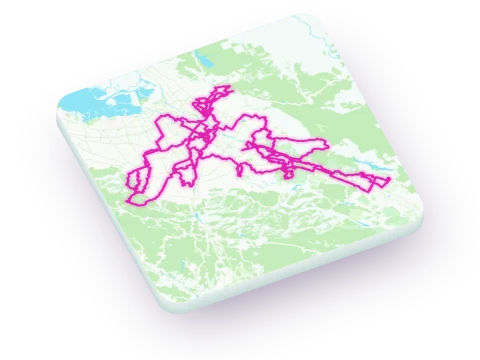 San Jose Typical run scores 8 out of 100 11% of what you can reach on foot is nature1,342 runs measured
- 48
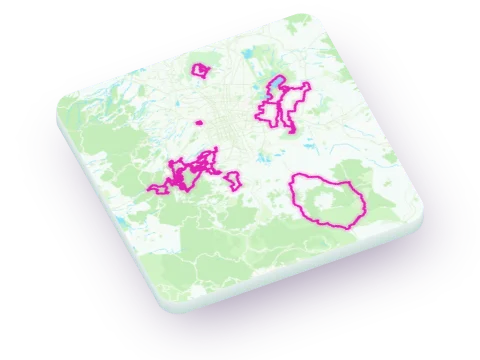 Mexico City Typical run scores 8 out of 100 14% of what you can reach on foot is nature1,306 runs measured
- 49
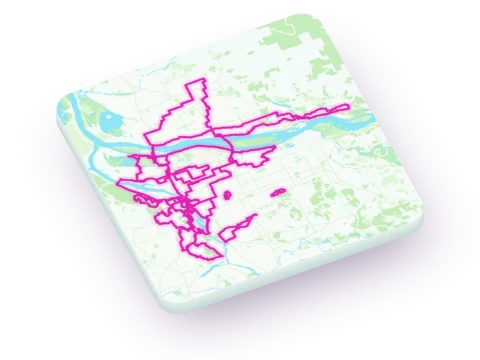 Portland Typical run scores 7 out of 100 12% of what you can reach on foot is nature1,408 runs measured
- 50
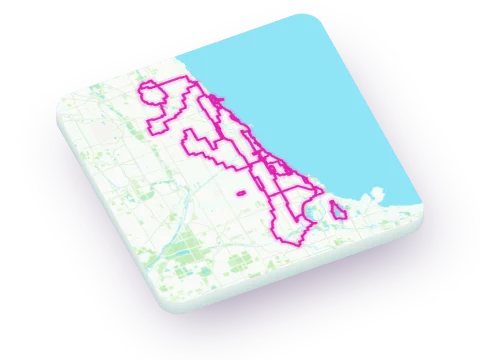 Chicago Typical run scores 7 out of 100 11% of what you can reach on foot is nature1,727 runs measured
- 51
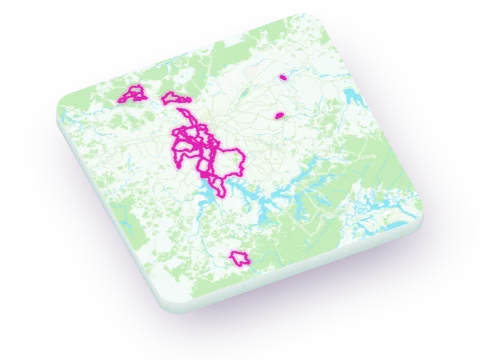 São Paulo Typical run scores 6 out of 100 13% of what you can reach on foot is nature1,126 runs measured
- 52
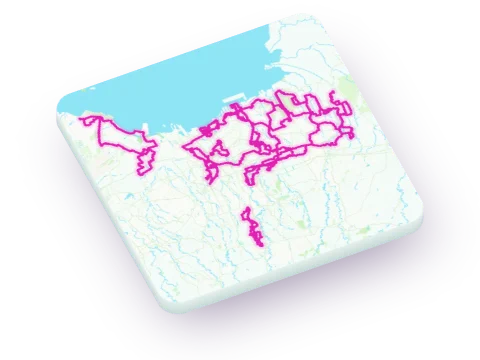 Jakarta Typical run scores 5 out of 100 12% of what you can reach on foot is nature1,016 runs measured
- 53
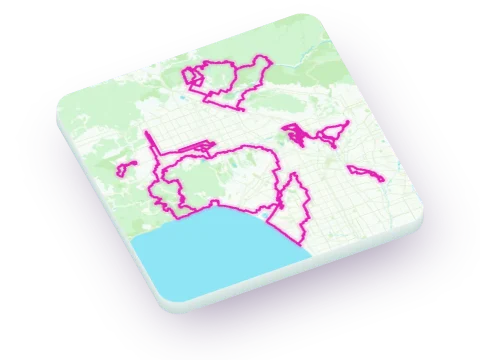 Los Angeles Typical run scores 5 out of 100 10% of what you can reach on foot is nature1,247 runs measured
- 54
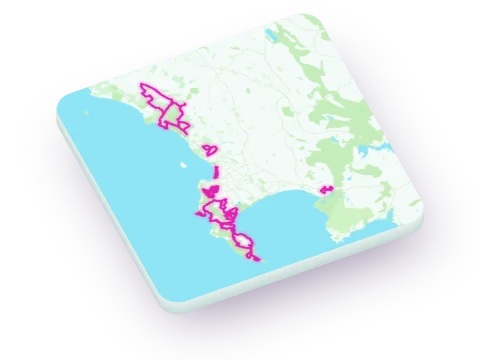 Cape Town Typical run scores 2 out of 100 13% of what you can reach on foot is nature1,110 runs measured
How cities are ranked
Every run is scored from the streets it travels: through nature 16%, views 36% and longest nature stretch 48%. Through nature, views and longest nature stretch make up its scenery, and the scenery loses the share of the run spent in stressful traffic: on a main road unless it is signed at 40 km/h or less, or on a side street signed over 50 km/h; a pavement counts as the road beside it. It also loses the time spent waiting at stops, traffic lights and busy roads crossed or joined: each stop costs 16 seconds of the 360 a kilometre takes. Starts near a station and climbing are measured but not scored. Typical is the middle score of the 5 km runs generated from up to 200 starting points spread evenly across the city: one on a residential street in each 500 m square, so every city is measured the same way, wherever its stations are.
Where each city stands out
Every city's typical route on each part of the score. The tick is the middle city; the city named is the one that does best.
As a table
| City | Through nature | Views | Longest nature stretch |
|---|---|---|---|
| Amsterdam | 53% | 0% | 33% |
| Madrid | 59% | 0% | 31% |
| Utrecht | 48% | 0% | 27% |
| Taipei | 53% | 0% | 28% |
| Zurich | 41% | 11% | 23% |
| Stockholm | 45% | 0% | 23% |
| Oslo | 44% | 0% | 23% |
| Edinburgh | 48% | 0% | 25% |
| San Francisco | 39% | 8% | 22% |
| Copenhagen | 54% | 0% | 30% |
| Seoul | 42% | 0% | 25% |
| Berlin | 45% | 0% | 24% |
| Wellington | 45% | 0% | 27% |
| Dresden | 35% | 0% | 20% |
| Boston | 44% | 0% | 25% |
| Hamburg | 41% | 0% | 21% |
| Ghent | 42% | 0% | 20% |
| Cologne | 37% | 0% | 22% |
| Munich | 39% | 0% | 21% |
| Bristol | 39% | 0% | 20% |
| Lisbon | 40% | 1% | 19% |
| Vienna | 40% | 0% | 20% |
| London | 39% | 0% | 21% |
| Melbourne | 40% | 0% | 20% |
| Paris | 38% | 0% | 19% |
| Barcelona | 43% | 7% | 19% |
| Lyon | 36% | 0% | 16% |
| Tokyo | 36% | 0% | 20% |
| Montréal | 37% | 0% | 17% |
| Seattle | 28% | 0% | 15% |
| Bogotá | 39% | 0% | 17% |
| Perth | 39% | 0% | 18% |
| Manchester | 36% | 0% | 18% |
| Sydney | 40% | 0% | 19% |
| Auckland | 44% | 0% | 23% |
| Dublin | 38% | 0% | 20% |
| Osaka | 36% | 0% | 19% |
| Valencia | 39% | 0% | 18% |
| Brisbane | 37% | 0% | 19% |
| Buenos Aires | 33% | 0% | 17% |
| Singapore | 28% | 0% | 15% |
| Vancouver | 29% | 0% | 15% |
| Boulder | 26% | 0% | 13% |
| New York | 31% | 0% | 17% |
| Rome | 32% | 0% | 16% |
| Toronto | 31% | 0% | 15% |
| San Jose | 19% | 0% | 12% |
| Mexico City | 20% | 0% | 11% |
| Portland | 17% | 0% | 11% |
| Chicago | 20% | 0% | 12% |
| São Paulo | 15% | 0% | 8% |
| Jakarta | 15% | 0% | 9% |
| Los Angeles | 13% | 0% | 9% |
| Cape Town | 20% | 0% | 11% |
Each part is the middle of the routes measured from residential streets across the city, the same ones the city ranking reads. Climbing is ranked in its own table.
The hilliest cities
How much the typical run climbs in each city. Climbing is measured but not scored, so hills neither lift a city nor hold it back.
| Rank | City | Metres up per km | Runs measured |
|---|---|---|---|
| 1 | Wellington | 35.5 | 1,375 |
| 2 | São Paulo | 22.1 | 1,126 |
| 3 | Oslo | 20.1 | 1,879 |
| 4 | San Francisco | 18.9 | 1,803 |
| 5 | Seattle | 18.1 | 1,750 |
| 6 | Seoul | 17.7 | 1,643 |
| 7 | Zurich | 17.5 | 1,873 |
| 8 | Lisbon | 15.3 | 1,841 |
| 9 | Barcelona | 13.2 | 1,958 |
| 10 | Auckland | 12.8 | 1,198 |
| 11 | Bristol | 12.6 | 1,858 |
| 12 | Sydney | 11.8 | 1,314 |
| 13 | Brisbane | 10.8 | 1,175 |
| 14 | Vancouver | 10.4 | 1,812 |
| 15 | Singapore | 10.3 | 1,658 |
| 16 | Edinburgh | 10.1 | 1,759 |
| 17 | Madrid | 9.7 | 1,847 |
| 18 | Rome | 9.6 | 1,127 |
| 19 | Stockholm | 9.4 | 1,816 |
| 20 | Dresden | 7.6 | 1,692 |
| 21 | Portland | 7.4 | 1,408 |
| 22 | Mexico City | 7.3 | 1,306 |
| 23 | Melbourne | 7.0 | 1,441 |
| 24 | Boulder | 6.8 | 1,589 |
| 25 | Boston | 6.6 | 1,434 |
| 26 | Taipei | 5.9 | 1,797 |
| 27 | Dublin | 5.6 | 1,472 |
| 28 | Perth | 5.4 | 1,422 |
| 29 | London | 5.2 | 1,705 |
| 30 | Toronto | 4.9 | 1,683 |
| 31 | Buenos Aires | 4.8 | 1,464 |
| 32 | Paris | 4.8 | 2,023 |
| 33 | New York | 4.4 | 1,660 |
| 34 | Los Angeles | 4.3 | 1,247 |
| 35 | Vienna | 4.2 | 1,802 |
| 36 | Cape Town | 3.9 | 1,110 |
| 37 | Manchester | 3.7 | 1,833 |
| 38 | Bogotá | 3.5 | 1,625 |
| 39 | Lyon | 3.5 | 1,884 |
| 40 | Hamburg | 2.9 | 1,680 |
| 41 | Jakarta | 2.5 | 1,016 |
| 42 | Tokyo | 2.4 | 1,790 |
| 43 | Montréal | 2.3 | 1,713 |
| 44 | San Jose | 1.9 | 1,342 |
| 45 | Berlin | 1.7 | 1,829 |
| 46 | Copenhagen | 1.7 | 1,811 |
| 47 | Cologne | 1.6 | 1,635 |
| 48 | Munich | 1.5 | 1,800 |
| 49 | Valencia | 1.2 | 1,739 |
| 50 | Osaka | 0.6 | 1,736 |
| 51 | Ghent | 0.5 | 1,602 |
| 52 | Amsterdam | 0.4 | 1,774 |
| 53 | Chicago | 0.0 | 1,727 |
| 54 | Utrecht | 0.0 | 1,849 |
How it is measured
Ranked by metres climbed per kilometre, using the median of the routes measured from residential streets across the city. These are the same routes used for the city ranking. Minor changes in elevation are filtered out.