The best cities for cycling and running, November 2026
This edition analyses 1,384,252 routes across 110,741 starting points in 54 cities. Every route is evaluated using the same criteria, making it possible to compare and rank routes and cities consistently.
The best runs
Best-scoring run at each distance in each city, with up to 10 cities per distance.
- 1From Nieuwe Willemsstraat Amsterdam 5.2 km 7 m up 80% nature Starts at Nieuwe Willemsstraat tram stop.
- 4 From Artillerivej, Copenhagen5.2 km, 3 m up, 100% through nature
- 5 From Oslo Hospital, Oslo4.8 km, 96 m up, 89% through nature
- 6 From Sickla kaj, Stockholm5.2 km, 43 m up, 97% through nature
- 7 From Meadowfield Gardens, Edinburgh4.6 km, 268 m up, 90% through nature
- 8 From Waterwinpark, Utrecht4.5 km, 0 m up, 96% through nature
- 9 From Strassenverkehrsamt, Zurich5.4 km, 350 m up, 73% through nature
- 10 Yangmingshan National Park, Taipei4.7 km, 393 m up, 100% through nature
- 3Yangmingshan National Park Taipei 10.5 km 543 m up 100% nature Starts at Juansi Waterfall bus stop.
- 4 From Batán, Madrid10.7 km, 122 m up, 80% through nature
- 5 From Seoksu Station, Seoul10 km, 780 m up, 91% through nature
- 6 From Björkhagen, Stockholm10.5 km, 174 m up, 91% through nature
- 7 From Zürich Schweighof, Zurich10.2 km, 456 m up, 78% through nature
- 8 From Quai Gillet, Lyon11 km, 185 m up, 83% through nature
- 9 From Mountcastle Bank, Edinburgh9.6 km, 317 m up, 78% through nature
- 10 From Øvre Svarttjern, Oslo10.6 km, 376 m up, 99% through nature
- 3Yangmingshan National Park Taipei 15.5 km 870 m up 100% nature Starts at Juansi Waterfall bus stop.
- 4 Kalvebod Fælled, Copenhagen14.6 km, 13 m up, 95% through nature
- 5 From Tavastehusgatan, Stockholm15.4 km, 126 m up, 98% through nature
- 6 From Dalsroa, Oslo14.2 km, 423 m up, 89% through nature
- 7 From Aravaca, Madrid15.4 km, 157 m up, 90% through nature
- 8 From Auzelg, Zurich14.5 km, 362 m up, 78% through nature
- 9 From Wadestown Road at Lytton Street, Wellington14.8 km, 696 m up, 77% through nature
- 10 From Hawkhill Close, Edinburgh14.7 km, 331 m up, 82% through nature
- 2Yangmingshan National Park Taipei 19.1 km 1,188 m up 100% nature Starts at Juansi Waterfall bus stop.
- 4 From Kringlevann, Oslo19.6 km, 567 m up, 98% through nature
- 5 From Skogskyrkogården, Stockholm19.2 km, 250 m up, 86% through nature
- 6 From Wadestown Road at Pitt Street, Wellington19.7 km, 1,047 m up, 80% through nature
- 7 From Drechselsgade, Copenhagen20.2 km, 16 m up, 92% through nature
- 8 From Madrid-Puerta de Atocha-Almudena Grandes, Madrid20.7 km, 273 m up, 74% through nature
- 9 From Arguello Boulevard & Fulton Street, San Francisco21.3 km, 338 m up, 100% through nature
- 10 Parc Natural de Collserola, Barcelona21.7 km, 1,071 m up, 90% through nature
How the distances are ranked
Cities are ranked by their typical run at each distance: the median score across every surveyed run, whether recommended or not. This means surveying more routes doesn't give a city more chances to rank highly.
Beyond 5 km, we compare only the starting points that performed best at 5 km. The number of qualifying starting points varies by city, so longer distances compare each city's strongest starting points rather than its entire surveyed area.
The run shown is the highest-scoring route for that city at the selected distance.
The best rides
Best-scoring ride at each distance in each city, with up to 10 cities per distance.
- 4 From Colonia Jardín, Madrid18.4 km, 199 m up, 84% through nature
- 5 From Rivierkom Zuid, Utrecht18.4 km, 7 m up, 62% through nature
- 6 From Vestamager, Copenhagen20.1 km, 26 m up, 81% through nature
- 7 From The Shore, Edinburgh19.5 km, 144 m up, 66% through nature
- 8 From Liljeholmen, Stockholm18.1 km, 120 m up, 89% through nature
- 9 From Hampton, Melbourne20.6 km, 94 m up, 62% through nature
- 10 From Thanggam, Singapore18.4 km, 83 m up, 76% through nature
- 4 From Rivierkom Zuid, Utrecht61.3 km, 9 m up, 75% through nature
- 5 From Nordhavn, Copenhagen65.1 km, 277 m up, 51% through nature
- 6 From Jongno 3(sam)-ga, Seoul58 km, 470 m up, 64% through nature
- 7 From S 114th St & Cornell Ave S, Seattle60.3 km, 775 m up, 48% through nature
- 8 From Colonia Jardín, Madrid55.6 km, 579 m up, 49% through nature
- 9 From Solln, Munich60.1 km, 487 m up, 35% through nature
- 10 From Wien Nußdorf, Vienna56.6 km, 77 m up, 51% through nature
- 4 From Bongeunsa, Seoul109 km, 697 m up, 66% through nature
- 5 From Hyde Street & Beach Street, San Francisco103 km, 1,596 m up, 54% through nature
- 6 From Ctra. Mejorada - Est. Henares, Madrid90.2 km, 683 m up, 54% through nature
- 7 From Pinedo, Valencia94.1 km, 102 m up, 60% through nature
- 8 From Singapore River Cruise, Singapore90.6 km, 764 m up, 63% through nature
- 9 From Tsukuda 5-chome, Osaka99.2 km, 134 m up, 60% through nature
- 10 From Vestamager, Copenhagen92.9 km, 185 m up, 44% through nature
How the distances are ranked
Cities are ranked by their typical ride at each distance: the median score across every surveyed ride, whether recommended or not. This means surveying more routes doesn't give a city more chances to rank highly.
Beyond 20 km, we compare only the starting points that performed best at 20 km. The number of qualifying starting points varies by city, so longer distances compare each city's strongest starting points rather than its entire surveyed area.
The ride shown is the highest-scoring route for that city at the selected distance.
The best cities for running and cycling
Each city gets an overall position based on its rankings for running and cycling, averaged into a single combined ranking.
- 1Amsterdam
- 2Taipei
- 3Utrecht
- 4Madrid
- 5Stockholm
- 6Seoul
- 7Edinburgh
- 8Copenhagen
- 9Oslo
- 10San Francisco
- 11Ghent
- 12Bristol
- 13Boston
- 14Munich
- 15Vienna
- 16Dresden
- 17Wellington
- 18Seattle
- 19Lyon
- 20Zurich
- 21Berlin
- 22Lisbon
- 23Cologne
- 24Paris
- 25Melbourne
- 26Montréal
- 27Hamburg
- 28London
- 29Singapore
- 30Barcelona
- 31Osaka
- 32Perth
- 33Bogotá
- 34Tokyo
- 35Valencia
- 36Sydney
- 37Manchester
- 38Vancouver
- 39Brisbane
- 40Dublin
- 41Buenos Aires
- 42New York
- 43Auckland
- 44Boulder
- 45Toronto
- 46San Jose
- 47Mexico City
- 48Rome
- 49Portland
- 50São Paulo
- 51Chicago
- 52Jakarta
- 53Los Angeles
- 54Cape Town
What you can reach from home
We measure what’s within reach from residential streets in each 500 m grid square. Figures show the median across all starting points.
As a table, and how it is measured
| City | Nature on foot | Nature by bike | Low stress by bike | Cycling infrastructure | Separated | Painted lanes | Starting points |
|---|---|---|---|---|---|---|---|
| Madrid | 50% (1) | 44% (3) | 17% (37) | 6% (44) | 6% | 1% | 1,134 |
| Amsterdam | 45% (2) | 48% (1) | 93% (3) | 36% (1) | 35% | 3% | 511 |
| Taipei | 43% (3) | 35% (7) | 16% (39) | 7% (41) | 6% | 1% | 664 |
| Copenhagen | 41% (4) | 37% (6) | 93% (2) | 28% (3) | 27% | 1% | 340 |
| Barcelona | 39% (5) | 41% (4) | 63% (13) | 12% (16) | 12% | 0% | 353 |
| Utrecht | 39% (6) | 35% (8) | 85% (5) | 31% (2) | 29% | 3% | 242 |
| Edinburgh | 38% (7) | 34% (10) | 46% (25) | 10% (28) | 9% | 2% | 530 |
| Valencia | 37% (8) | 28% (23) | 59% (19) | 14% (15) | 13% | 0% | 304 |
| Wellington | 36% (9) | 39% (5) | 7% (41) | 11% (22) | 10% | 1% | 367 |
| Berlin | 35% (10) | 32% (13) | 60% (16) | 18% (9) | 17% | 3% | 2,700 |
| Auckland | 35% (11) | 32% (12) | 1% (52) | 9% (29) | 8% | 2% | 3,687 |
| Ghent | 34% (12) | 29% (18) | 79% (7) | 22% (6) | 20% | 5% | 450 |
| Paris | 34% (13) | 28% (21) | 66% (10) | 17% (12) | 14% | 8% | 393 |
| Oslo | 34% (14) | 45% (2) | 60% (17) | 10% (25) | 9% | 3% | 596 |
| Lisbon | 32% (15) | 30% (16) | 3% (44) | 6% (45) | 6% | 0% | 331 |
| Bogotá | 31% (16) | 26% (27) | 1% (48) | 7% (37) | 7% | 1% | 1,775 |
| Lyon | 31% (17) | 22% (33) | 63% (14) | 18% (10) | 12% | 12% | 203 |
| Vienna | 31% (18) | 30% (15) | 63% (12) | 19% (8) | 17% | 5% | 1,227 |
| San Francisco | 31% (19) | 27% (26) | 74% (8) | 8% (34) | 5% | 7% | 464 |
| Munich | 30% (20) | 31% (14) | 89% (4) | 27% (4) | 26% | 1% | 1,053 |
| Melbourne | 30% (21) | 29% (19) | 4% (43) | 12% (17) | 11% | 3% | 12,060 |
| Hamburg | 29% (22) | 26% (28) | 62% (15) | 17% (11) | 16% | 3% | 2,002 |
| Zurich | 28% (23) | 29% (17) | 49% (23) | 10% (26) | 7% | 6% | 291 |
| Boston | 28% (24) | 25% (29) | 44% (29) | 10% (24) | 7% | 7% | 496 |
| Perth | 28% (25) | 28% (24) | 1% (50) | 11% (23) | 10% | 2% | 7,113 |
| Sydney | 27% (26) | 27% (25) | 2% (46) | 9% (30) | 8% | 2% | 9,250 |
| London | 27% (27) | 22% (34) | 26% (34) | 8% (36) | 7% | 1% | 5,252 |
| Stockholm | 27% (28) | 33% (11) | 95% (1) | 26% (5) | 26% | 1% | 714 |
| Brisbane | 27% (29) | 29% (20) | 2% (47) | 11% (20) | 11% | 1% | 8,332 |
| Bristol | 27% (30) | 20% (37) | 46% (26) | 11% (21) | 10% | 2% | 398 |
| Seoul | 26% (31) | 24% (31) | 6% (42) | 7% (42) | 6% | 0% | 1,935 |
| Montréal | 26% (32) | 19% (43) | 57% (20) | 12% (18) | 9% | 6% | 1,273 |
| Dublin | 25% (33) | 22% (32) | 1% (51) | 12% (19) | 9% | 5% | 1,660 |
| Manchester | 24% (34) | 20% (39) | 21% (36) | 9% (32) | 8% | 2% | 461 |
| New York | 24% (35) | 20% (40) | 45% (27) | 7% (38) | 5% | 4% | 2,887 |
| Dresden | 24% (36) | 34% (9) | 49% (24) | 8% (33) | 7% | 2% | 816 |
| Rome | 23% (37) | 28% (22) | 1% (49) | 3% (48) | 3% | 0% | 2,840 |
| Singapore | 22% (38) | 22% (35) | 2% (45) | 14% (14) | 14% | 0% | 1,377 |
| Osaka | 22% (39) | 20% (38) | 38% (32) | 3% (50) | 2% | 0% | 784 |
| Buenos Aires | 22% (40) | 17% (44) | 54% (22) | 6% (43) | 6% | 0% | 776 |
| Cologne | 21% (41) | 25% (30) | 73% (9) | 17% (13) | 16% | 3% | 1,015 |
| Toronto | 21% (42) | 20% (41) | 16% (38) | 7% (40) | 5% | 2% | 2,151 |
| Seattle | 20% (43) | 17% (45) | 84% (6) | 7% (39) | 6% | 3% | 854 |
| Tokyo | 20% (44) | 16% (47) | 38% (31) | 2% (52) | 1% | 1% | 2,296 |
| Vancouver | 19% (45) | 20% (36) | 64% (11) | 8% (35) | 6% | 4% | 472 |
| Boulder | 18% (46) | 20% (42) | 57% (21) | 22% (7) | 18% | 8% | 245 |
| Mexico City | 14% (47) | 16% (46) | 37% (33) | 2% (51) | 1% | 0% | 3,713 |
| São Paulo | 13% (48) | 13% (48) | 21% (35) | 3% (49) | 1% | 3% | 4,510 |
| Cape Town | 13% (49) | 13% (49) | 0% (54) | 1% (53) | 1% | 0% | 3,881 |
| Jakarta | 12% (50) | 12% (50) | 0% (53) | 0% (54) | 0% | 0% | 2,598 |
| Portland | 12% (51) | 11% (52) | 59% (18) | 9% (31) | 4% | 9% | 1,106 |
| San Jose | 11% (52) | 11% (53) | 39% (30) | 10% (27) | 3% | 14% | 1,368 |
| Chicago | 11% (53) | 11% (51) | 44% (28) | 5% (46) | 3% | 3% | 2,159 |
| Los Angeles | 10% (54) | 10% (54) | 9% (40) | 4% (47) | 2% | 4% | 4,214 |
The number in brackets is the city's rank for that figure, with the highest-ranked city first.
Nature is the share of the streets and paths you can reach that pass through parks, forests or along water.
Low stress is the share of the streets you can reach by bike that most adults would feel comfortable riding. This includes cycleways, side streets signed up to 50 km/h, main roads up to 40 km/h, and painted cycle lanes on smaller main roads signed up to 50 km/h.
Roads can be crossed without traffic lights if they are signed up to 50 km/h and have no more than 5 lanes, or signed up to 60 km/h and have no more than 3 lanes. Roads with a central median, counting lanes on both sides together, can be crossed without traffic lights at any width if signed up to 40 km/h. Faster or wider roads can only be crossed at traffic lights.
Cycling infrastructure is the share of separated cycling infrastructure plus 50% of the share of painted cycle lanes. Separated infrastructure includes cycleways, bicycle streets, protected tracks and shared paths with pedestrians that are signed for cycling.
Cities measured from fewer than 3 starting points on foot, or fewer than 3 by bike, are excluded from the rankings.
Districts
| Rank | District | City | Nature on foot | Starting points |
|---|---|---|---|---|
| 1 | Bradbænken | Copenhagen | 77% | 3 |
| 2 | Roseneath | Wellington | 68% | 4 |
| 3 | Presidio | San Francisco | 66% | 21 |
| 4 | Puerto Madero | Buenos Aires | 65% | 12 |
| 5 | Norra innerstadens stadsdelsområde | Stockholm | 63% | 79 |
| 6 | Marka | Oslo | 63% | 25 |
| 7 | Södermalms stadsdelsområde | Stockholm | 63% | 40 |
| 8 | Fisketorvet | Copenhagen | 63% | 9 |
| 9 | Carabanchel | Madrid | 61% | 56 |
| 10 | Usera | Madrid | 61% | 34 |
| 11 | Langebrück | Dresden | 60% | 14 |
| 12 | Sutro Heights | San Francisco | 60% | 3 |
| 13 | Freetown Christiania | Copenhagen | 60% | 4 |
| 14 | Moratalaz | Madrid | 60% | 23 |
| 15 | Outer Richmond | San Francisco | 60% | 16 |
| 16 | Ajuda | Lisbon | 59% | 9 |
| 17 | Oost | Amsterdam | 59% | 86 |
| 18 | West End | Vancouver | 59% | 13 |
| 19 | Kongens Enghave | Copenhagen | 59% | 6 |
| 20 | Oriental Bay | Wellington | 58% | 3 |
The top 20 districts across every city with routes and at least 3 starting points measuring each figure, on foot and by bike.
The cities in this edition
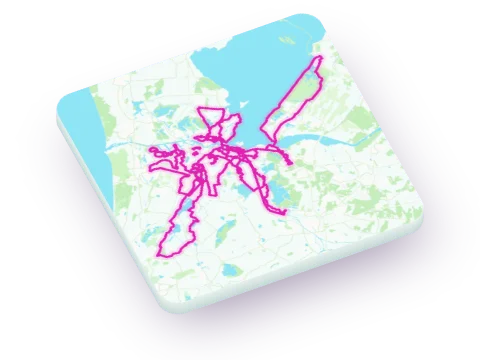 Amsterdam
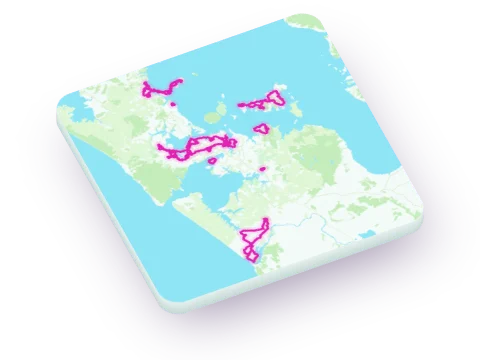 Auckland
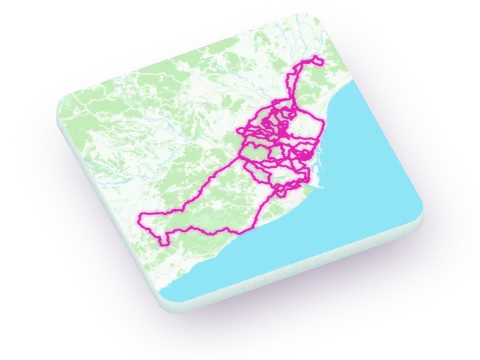 Barcelona
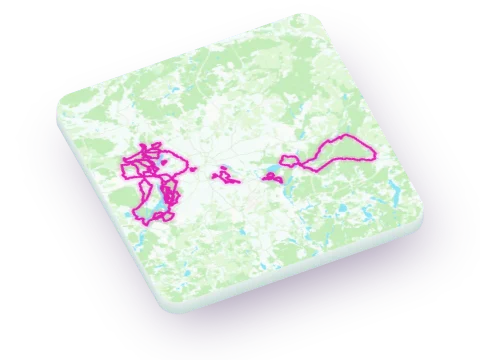 Berlin
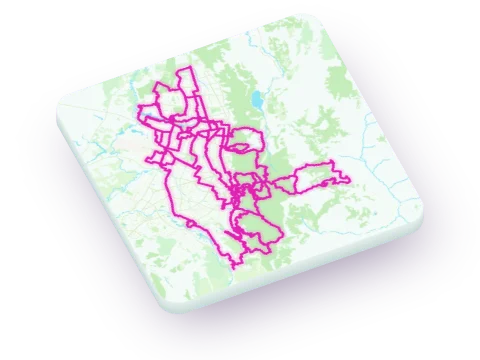 Bogotá
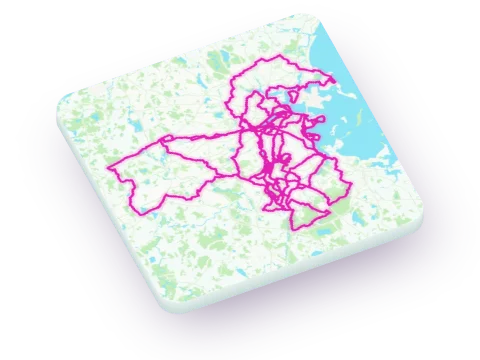 Boston
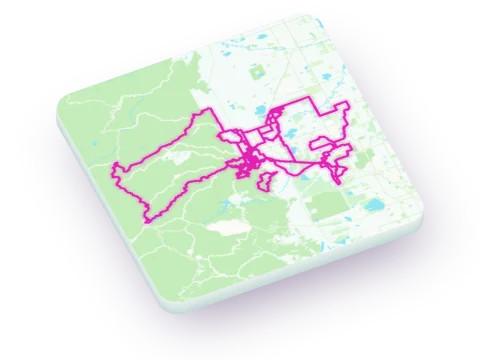 Boulder
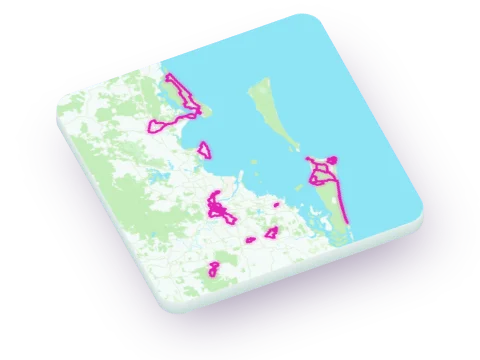 Brisbane
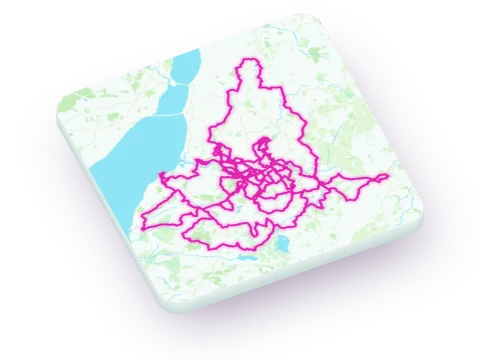 Bristol
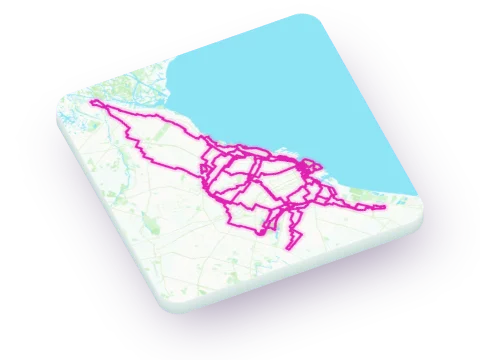 Buenos Aires
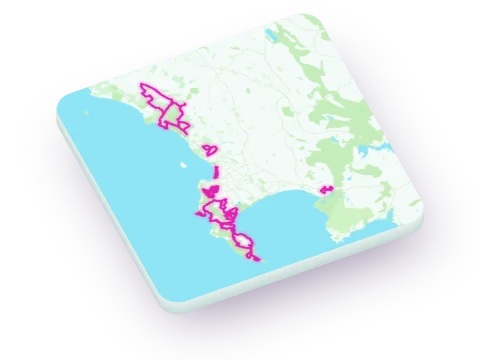 Cape Town
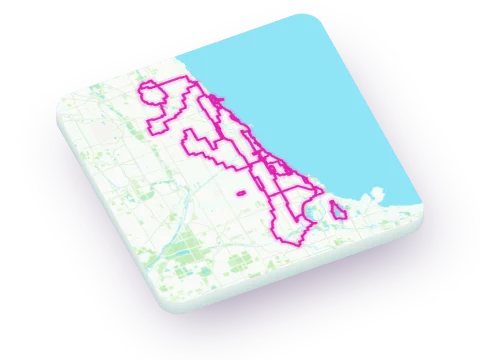 Chicago
 Cologne
 Copenhagen
 Dresden
 Dublin
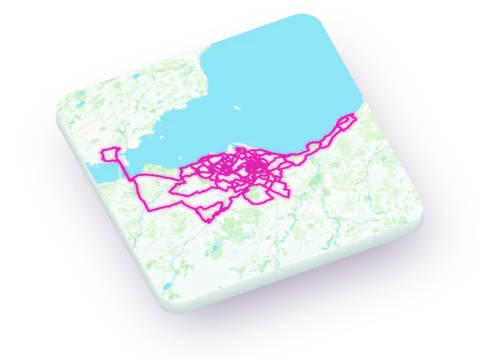 Edinburgh
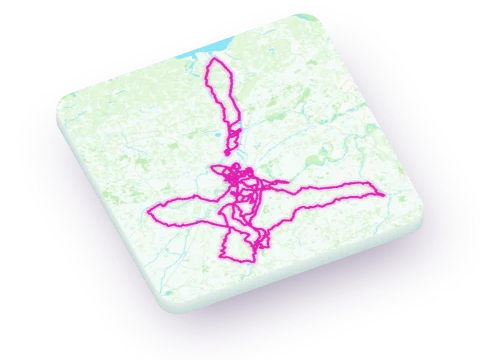 Ghent
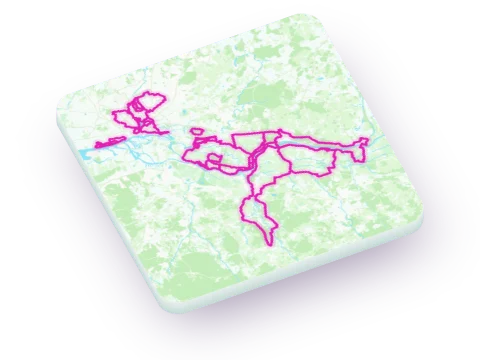 Hamburg
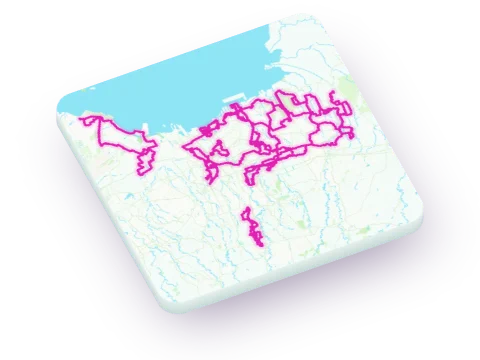 Jakarta
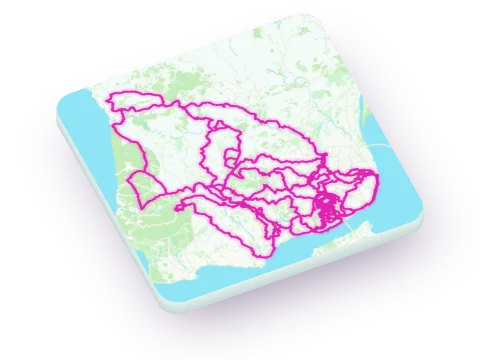 Lisbon
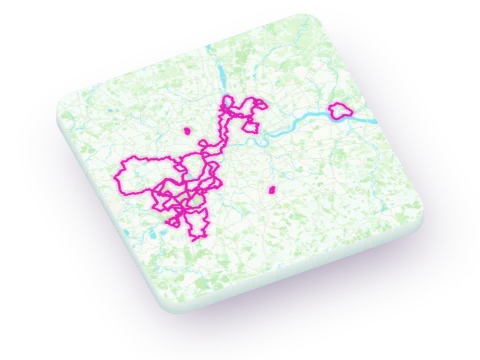 London
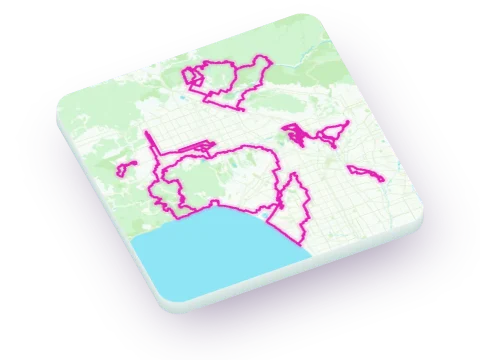 Los Angeles
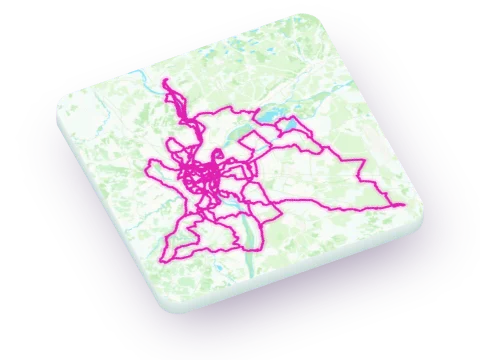 Lyon
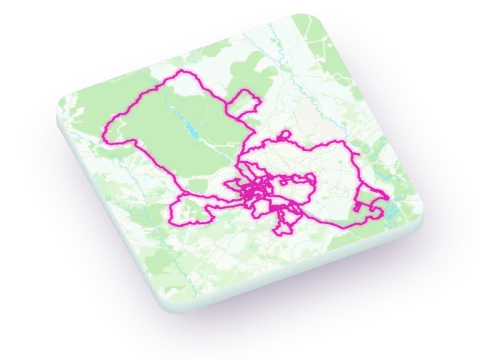 Madrid
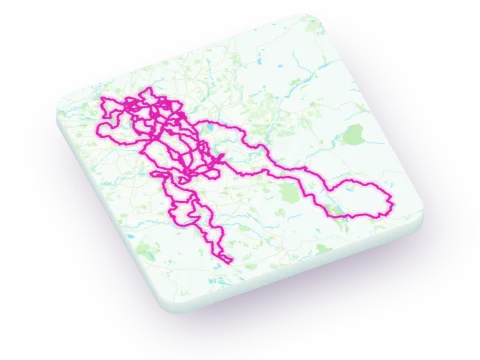 Manchester
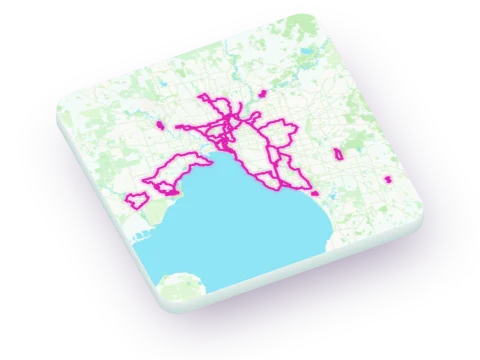 Melbourne
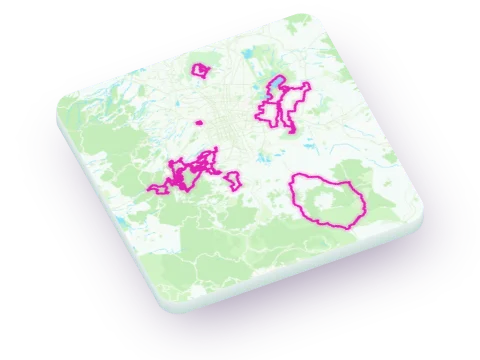 Mexico City
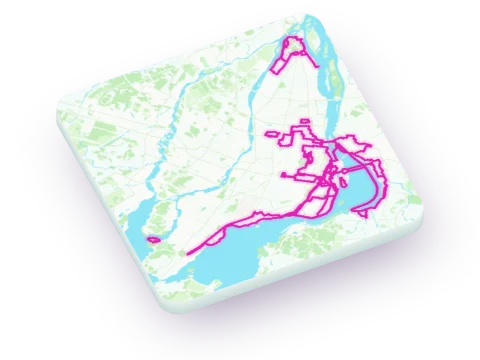 Montréal
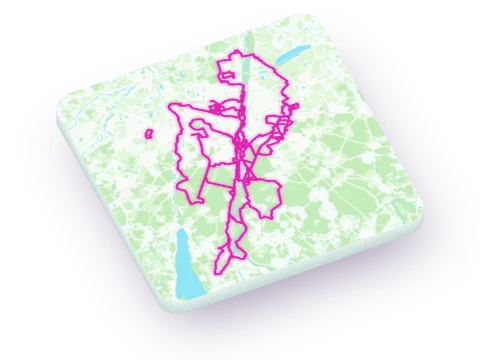 Munich
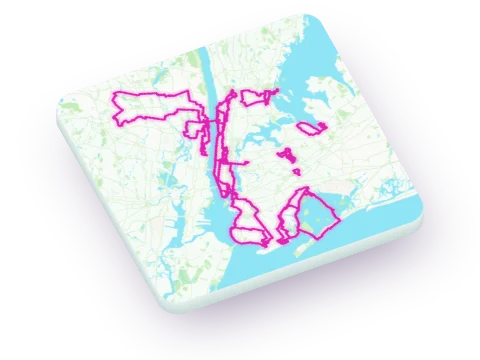 New York
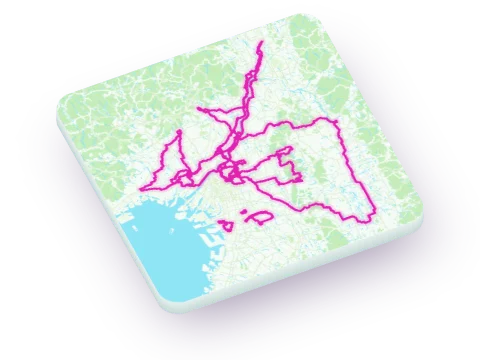 Osaka
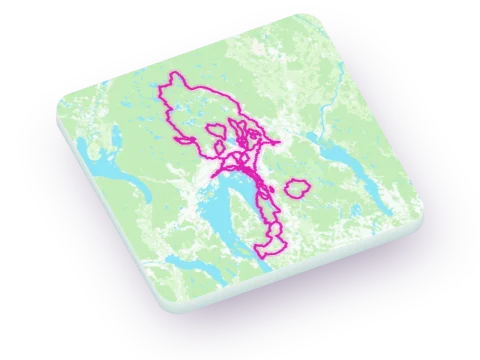 Oslo
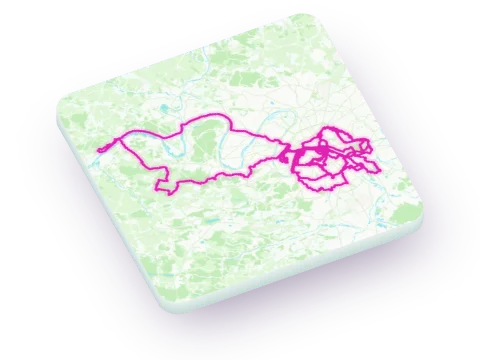 Paris
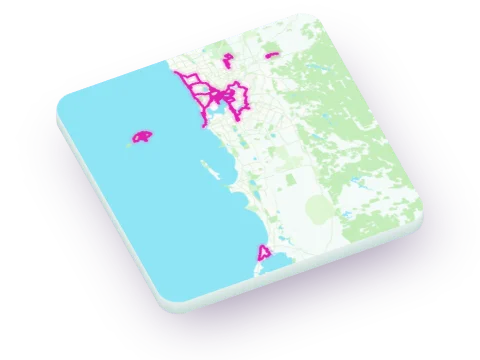 Perth
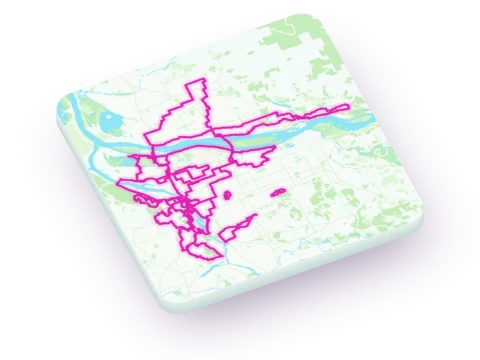 Portland
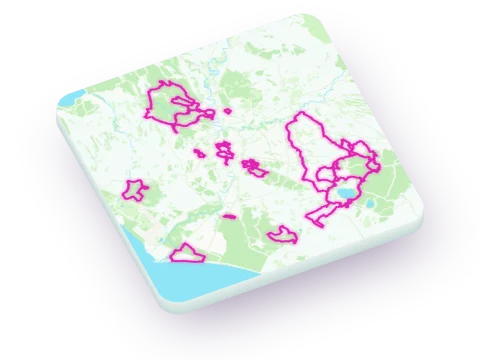 Rome
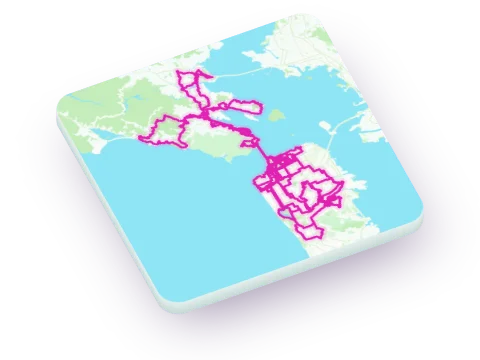 San Francisco
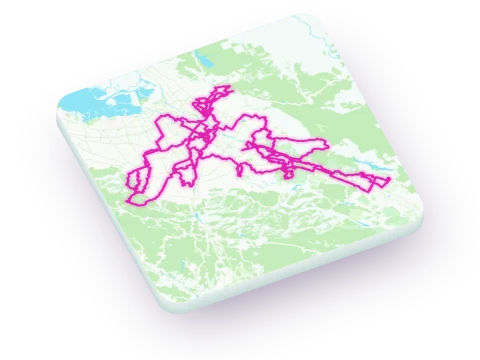 San Jose
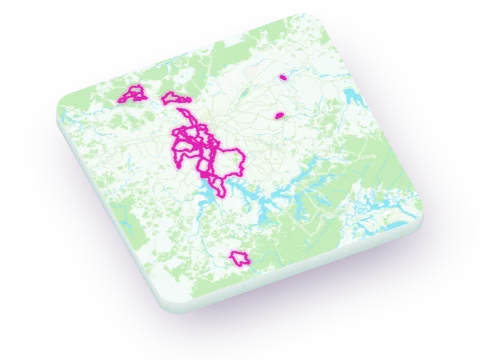 São Paulo
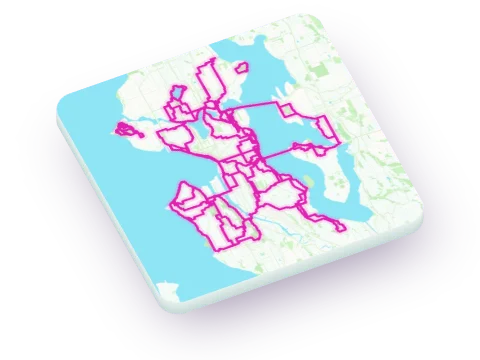 Seattle
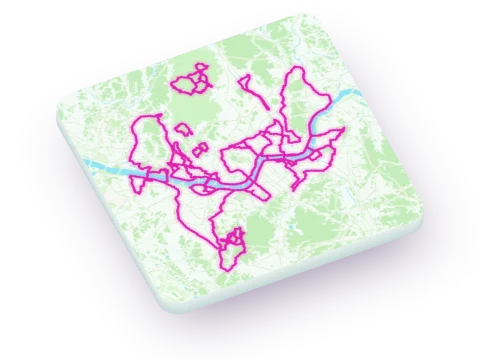 Seoul
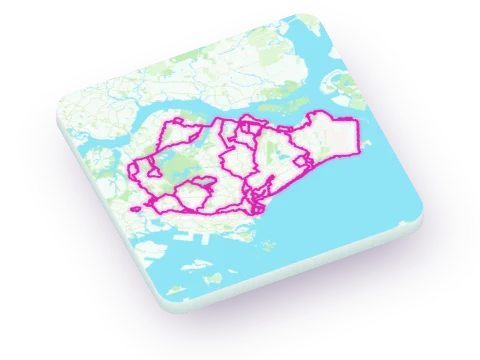 Singapore
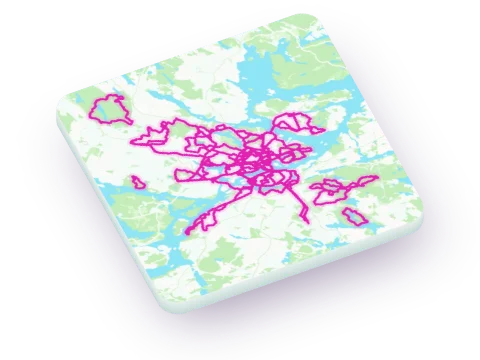 Stockholm
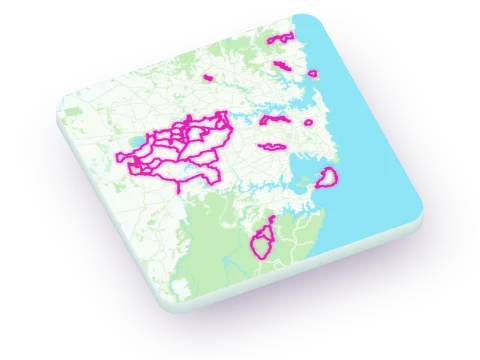 Sydney
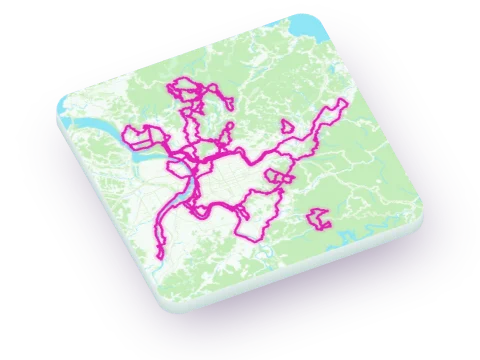 Taipei
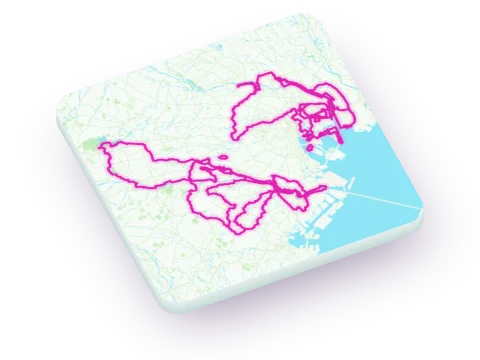 Tokyo
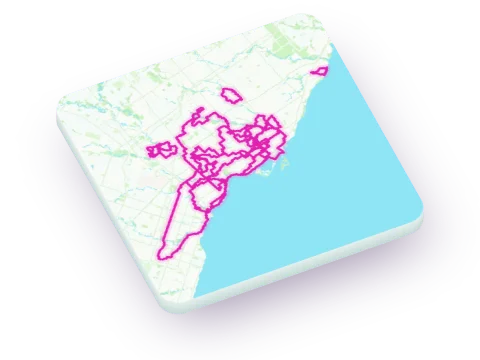 Toronto
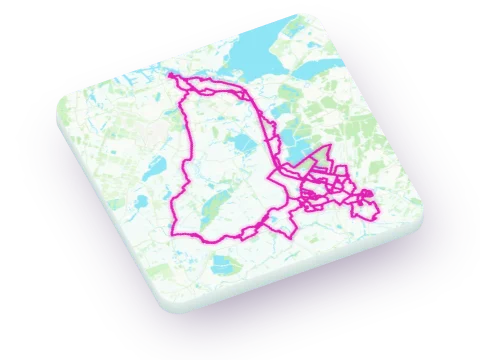 Utrecht
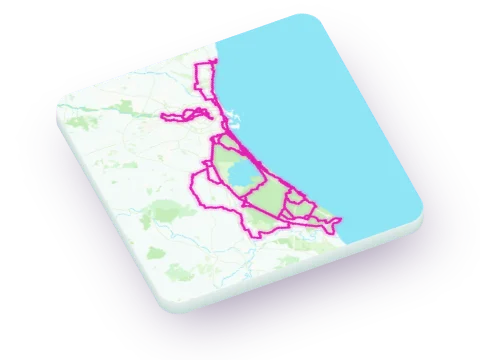 Valencia
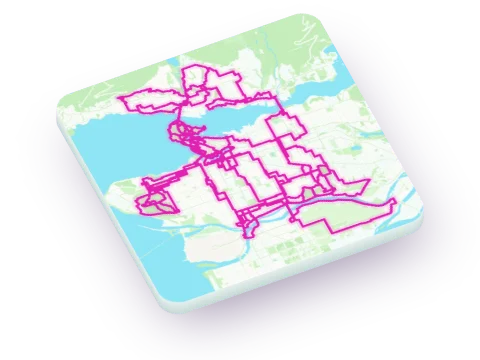 Vancouver
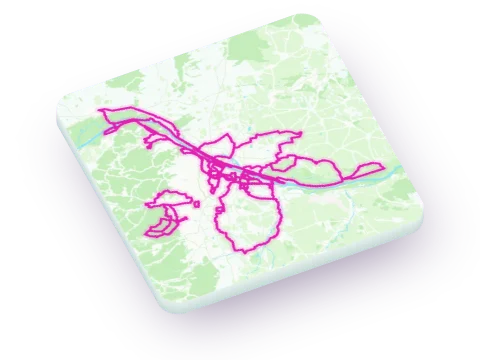 Vienna
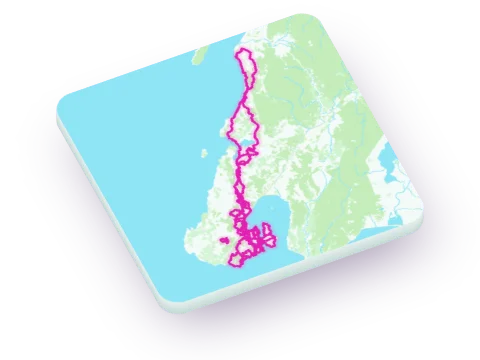 Wellington
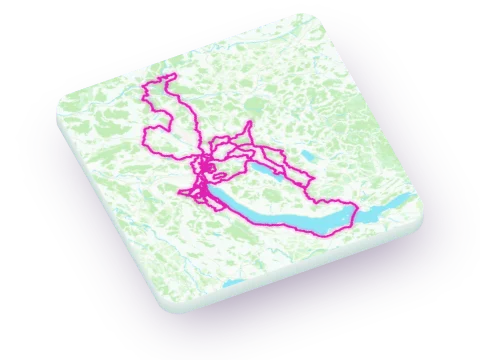 Zurich
How each city's routes are built and scored is on its own method page, for example Amsterdam's.