The best cities for running
Each city's typical run, scored the same way everywhere. The tick is the middle city.
- 1
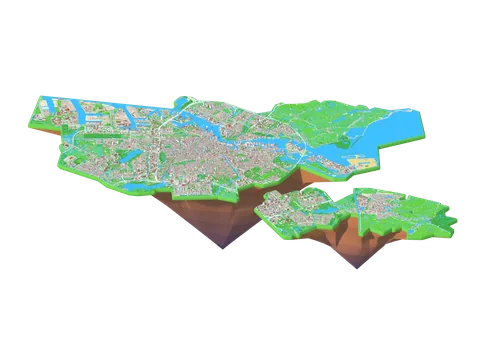 Amsterdam 77% typical 92% recommended69% nature on foot3,260 runs measured
- 2
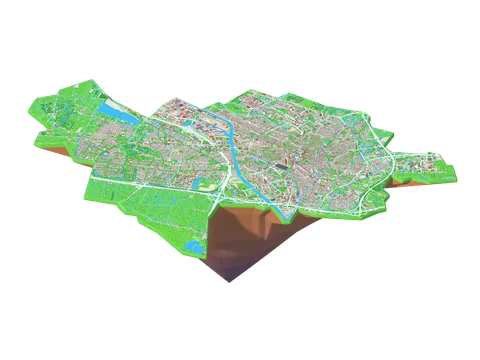 Utrecht 68% typical 85% recommended55% nature on foot2,699 runs measured
- 3
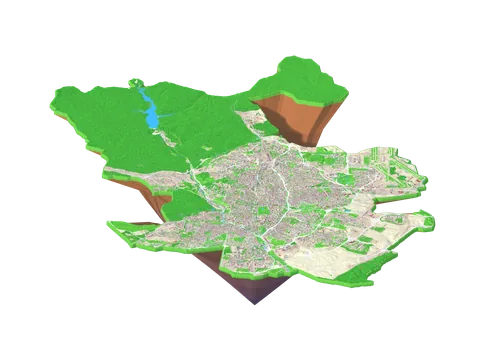 Madrid 65% typical 88% recommended51% nature on foot6,219 runs measured
- 4
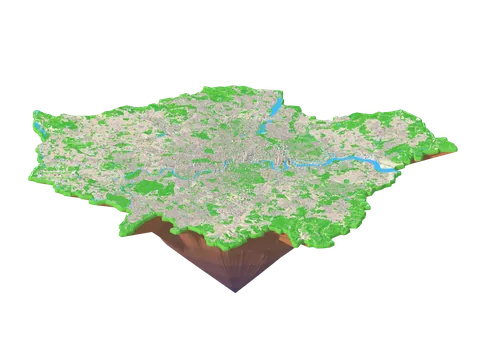 London 65% typical 84% recommended28% nature on foot4,803 runs measured
- 5
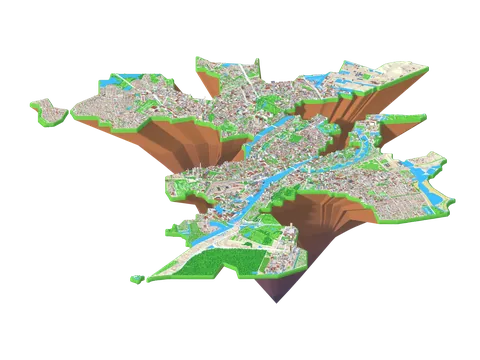 Copenhagen 62% typical 80% recommended41% nature on foot2,864 runs measured
- 6
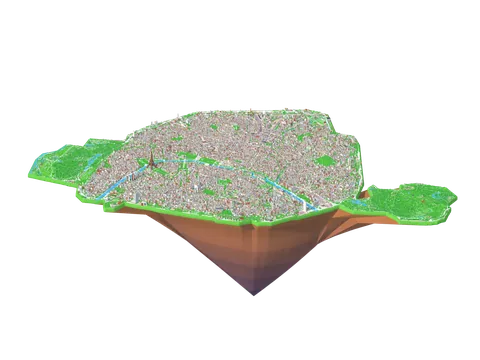 Paris 62% typical 83% recommended35% nature on foot3,752 runs measured
- 7
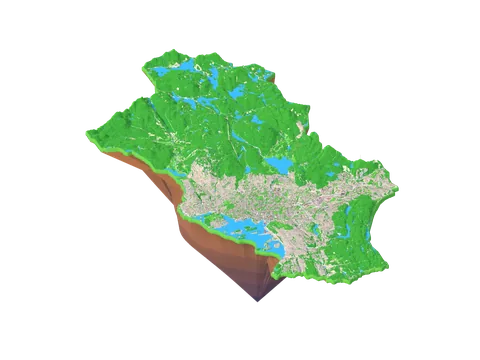 Oslo 62% typical 82% recommended34% nature on foot3,990 runs measured
- 8
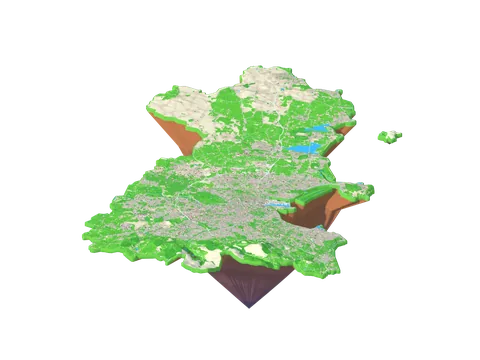 Dublin 62% typical 78% recommended26% nature on foot893 runs measured
- 9
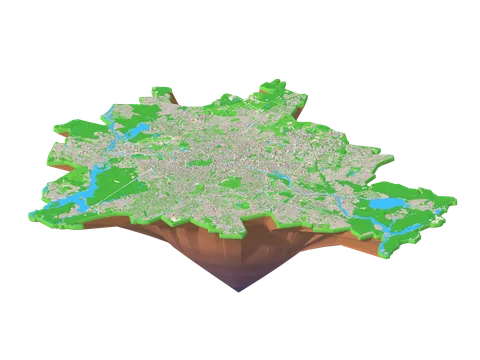 Berlin 62% typical 87% recommended36% nature on foot6,553 runs measured
- 10
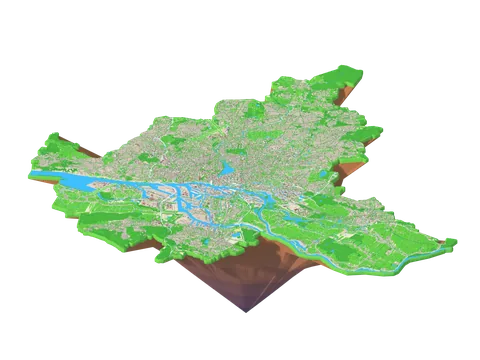 Hamburg 62% typical 85% recommended30% nature on foot3,517 runs measured
- 11
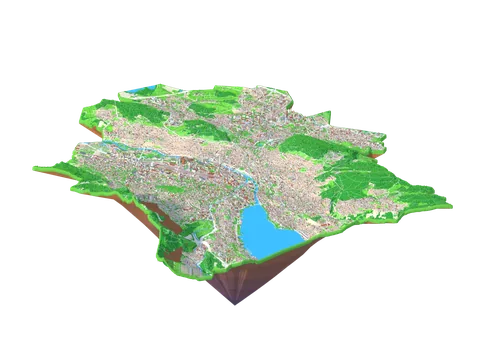 Zurich 61% typical 77% recommended29% nature on foot1,887 runs measured
- 12
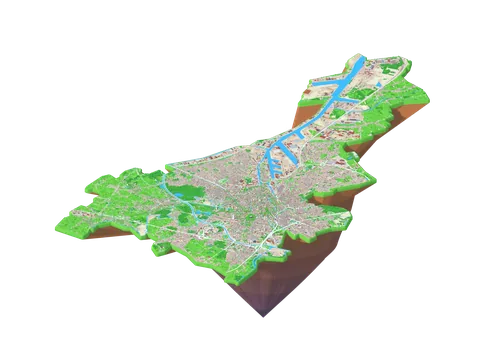 Ghent 61% typical 77% recommended40% nature on foot2,221 runs measured
- 13
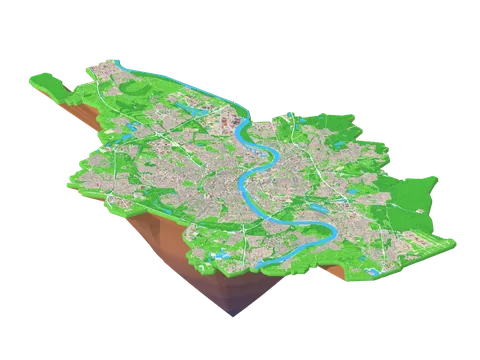 Cologne 61% typical 81% recommended22% nature on foot1,835 runs measured
- 14
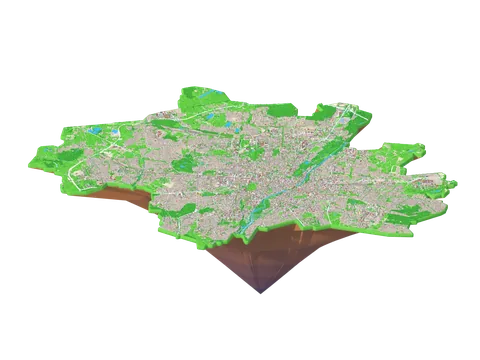 Munich 61% typical 80% recommended30% nature on foot3,778 runs measured
- 15
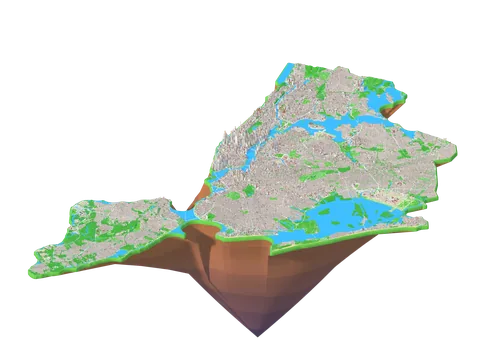 New York 61% typical 91% recommended24% nature on foot4,467 runs measured
- 16
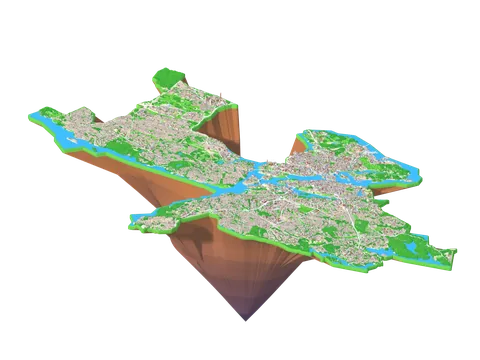 Stockholm 61% typical 87% recommended27% nature on foot5,099 runs measured
- 17
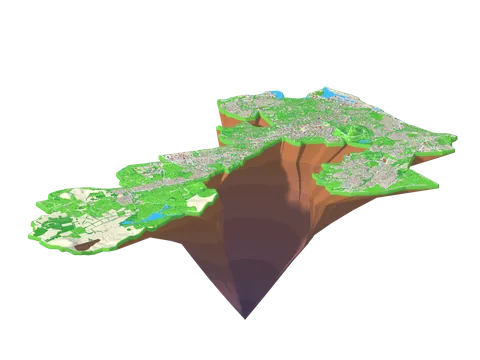 Edinburgh 61% typical 77% recommended38% nature on foot7,400 runs measured
- 18
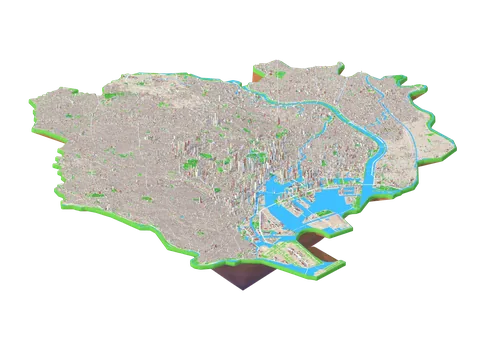 Tokyo 61% typical 80% recommended20% nature on foot4,672 runs measured
- 19
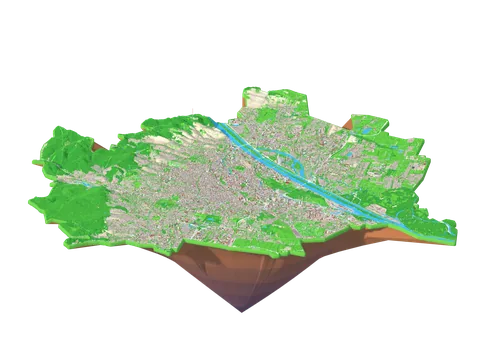 Vienna 60% typical 84% recommended31% nature on foot5,419 runs measured
- 20
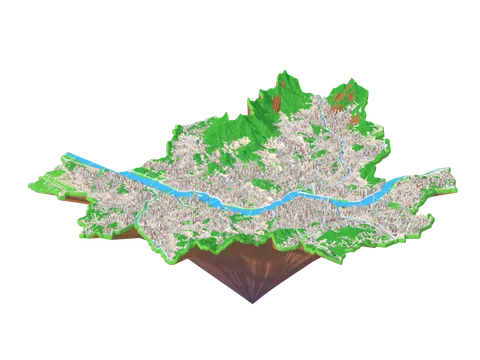 Seoul 60% typical 86% recommended25% nature on foot7,099 runs measured
- 21
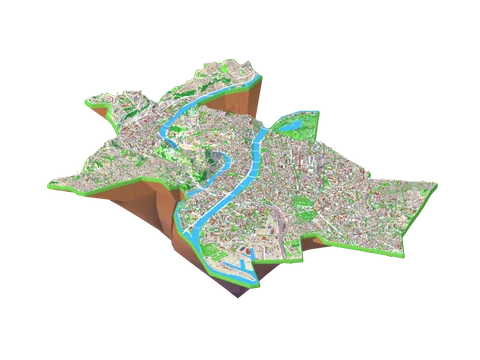 Lyon 59% typical 80% recommended32% nature on foot2,891 runs measured
- 22
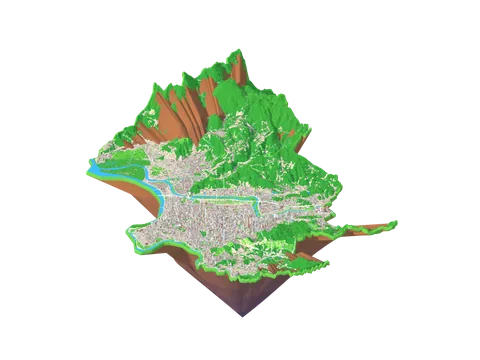 Taipei 58% typical 85% recommended43% nature on foot9,914 runs measured
- 23
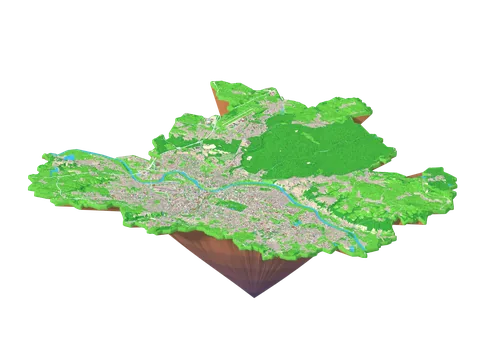 Dresden 58% typical 81% recommended23% nature on foot3,019 runs measured
- 24
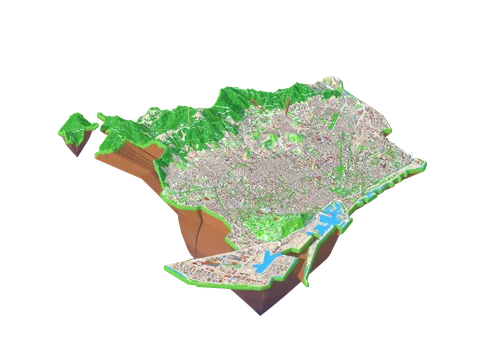 Barcelona 58% typical 84% recommended40% nature on foot3,199 runs measured
- 25
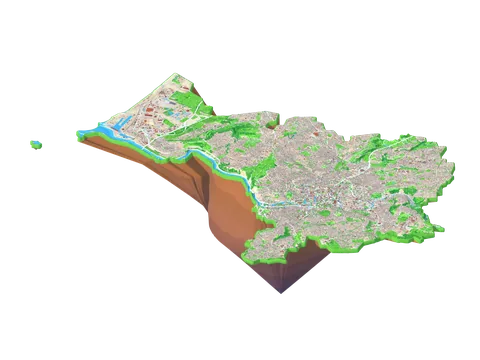 Bristol 57% typical 73% recommended27% nature on foot5,639 runs measured
- 26
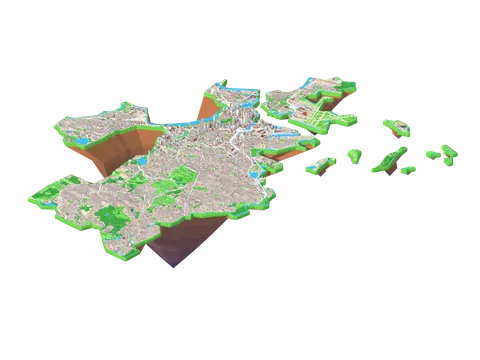 Boston 57% typical 80% recommended29% nature on foot12,857 runs measured
- 27
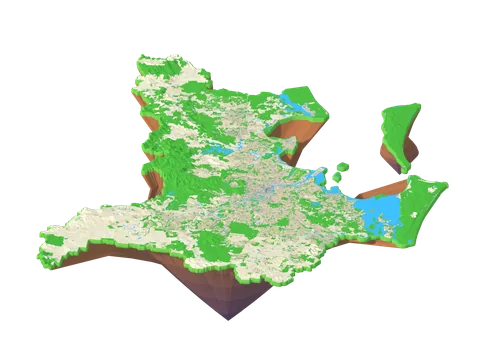 Brisbane 55% typical 79% recommended27% nature on foot4,998 runs measured
- 28
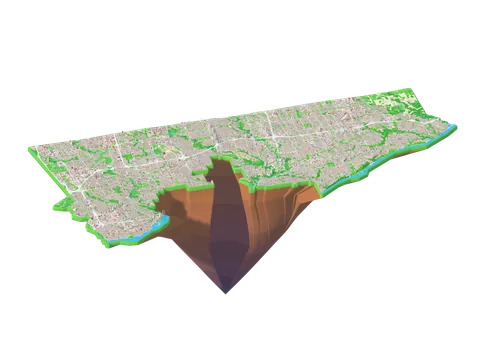 Toronto 55% typical 84% recommended21% nature on foot2,829 runs measured
- 29
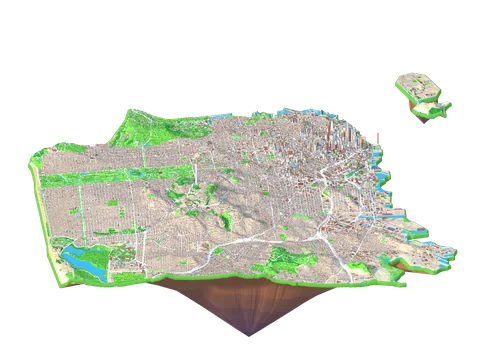 San Francisco 55% typical 77% recommended31% nature on foot19,752 runs measured
- 30
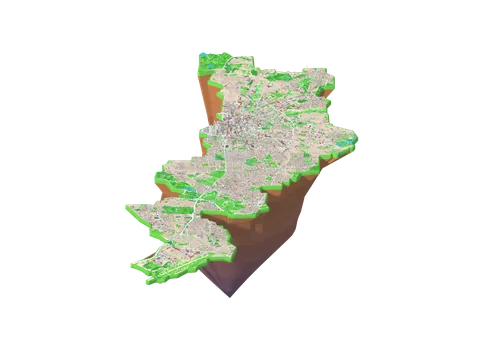 Manchester 55% typical 71% recommended25% nature on foot13,188 runs measured
- 31
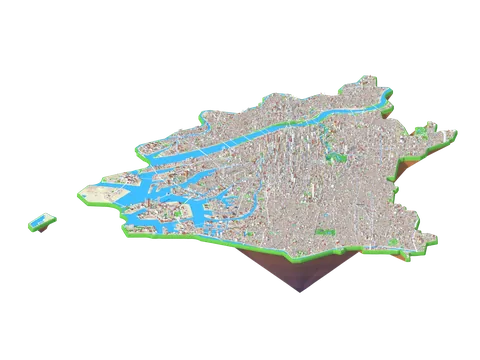 Osaka 55% typical 79% recommended22% nature on foot4,989 runs measured
- 32
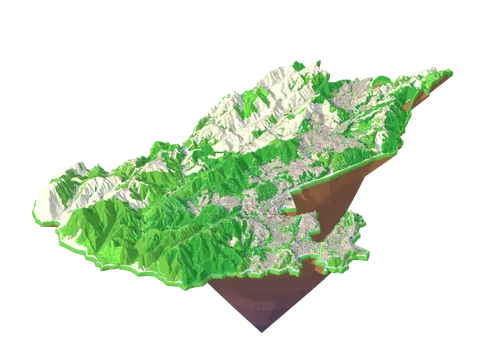 Wellington 55% typical 71% recommended35% nature on foot8,358 runs measured
- 33
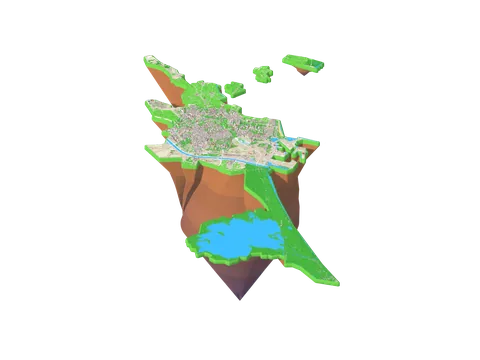 Valencia 55% typical 77% recommended37% nature on foot7,563 runs measured
- 34
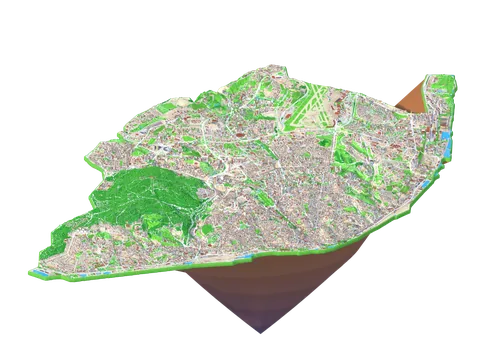 Lisbon 55% typical 78% recommended33% nature on foot8,718 runs measured
- 35
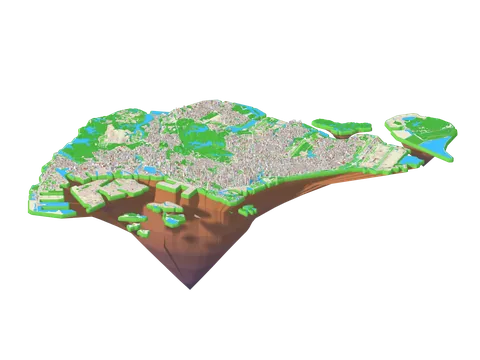 Singapore 55% typical 80% recommended26% nature on foot6,214 runs measured
- 36
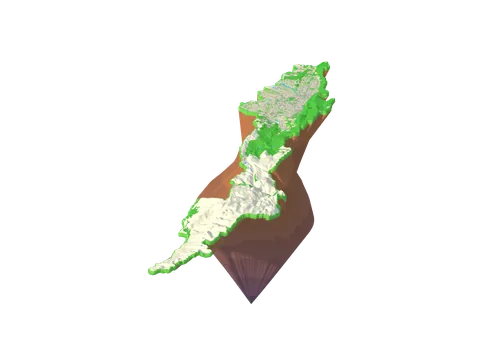 Bogotá 55% typical 77% recommended32% nature on foot20,139 runs measured
- 37
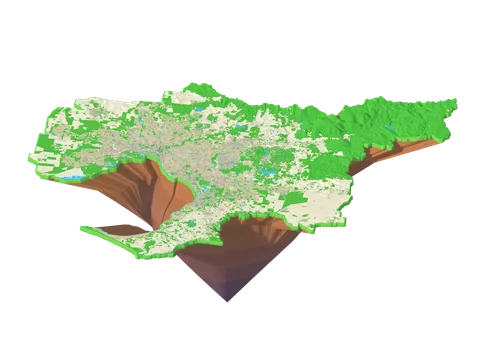 Melbourne 54% typical 81% recommended29% nature on foot57,527 runs measured
- 38
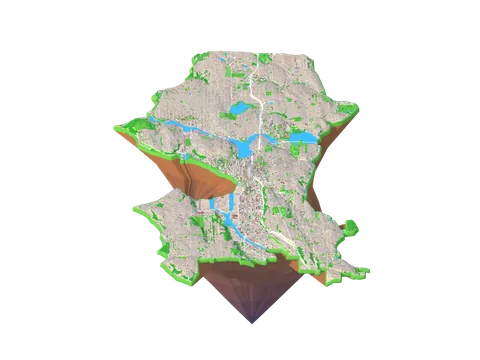 Seattle 53% typical 70% recommended20% nature on foot15,526 runs measured
- 39
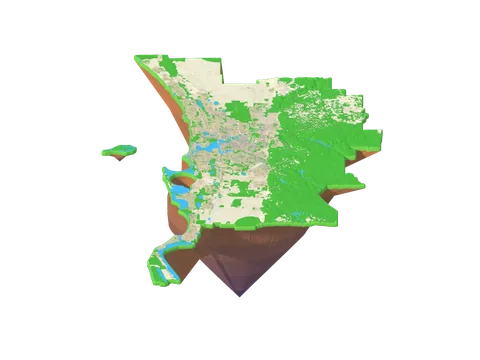 Perth 52% typical 83% recommended28% nature on foot80,566 runs measured
- 40
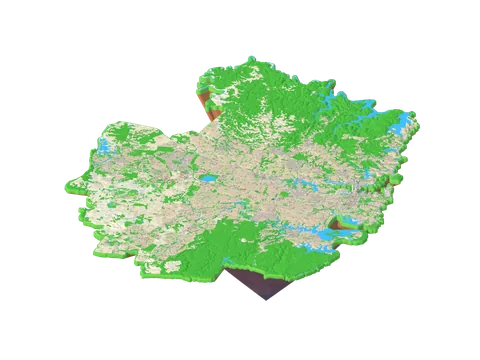 Sydney 52% typical 80% recommended28% nature on foot67,848 runs measured
- 41
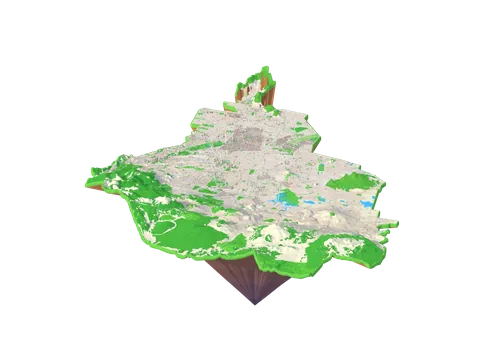 Mexico City 52% typical 72% recommended15% nature on foot3,730 runs measured
- 42
 Jakarta 51% typical 70% recommended13% nature on foot644 runs measured
- 43
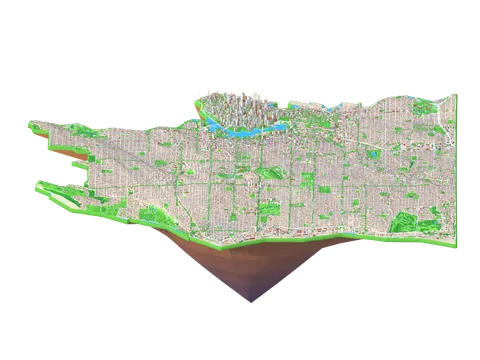 Vancouver 51% typical 76% recommended19% nature on foot12,940 runs measured
- 44
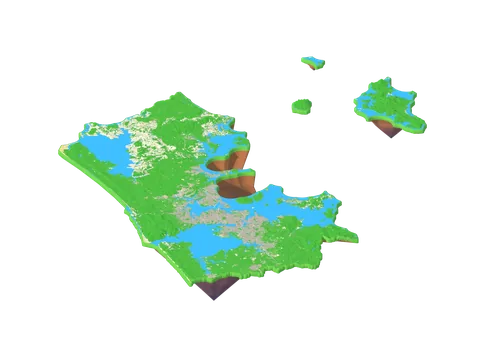 Auckland 51% typical 80% recommended35% nature on foot22,966 runs measured
- 45
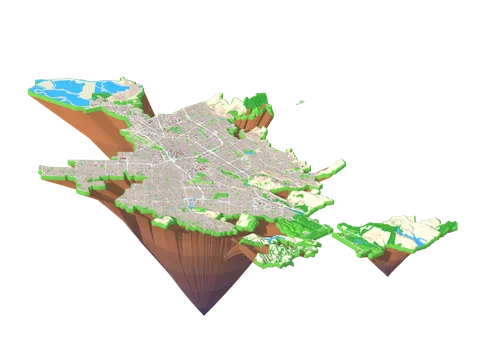 San Jose 49% typical 70% recommended11% nature on foot2,925 runs measured
- 46
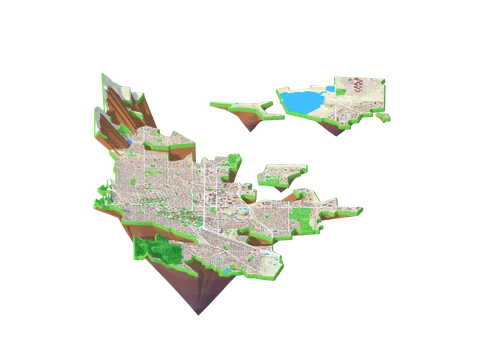 Boulder 49% typical 73% recommended19% nature on foot3,168 runs measured
- 47
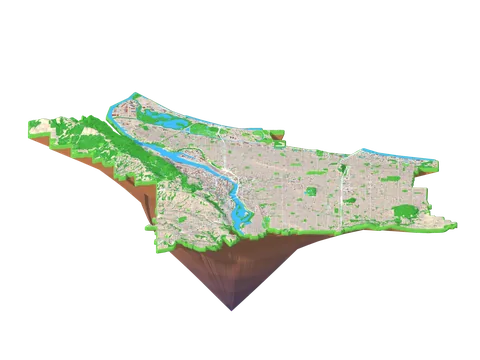 Portland 48% typical 64% recommended12% nature on foot15,769 runs measured
- 48
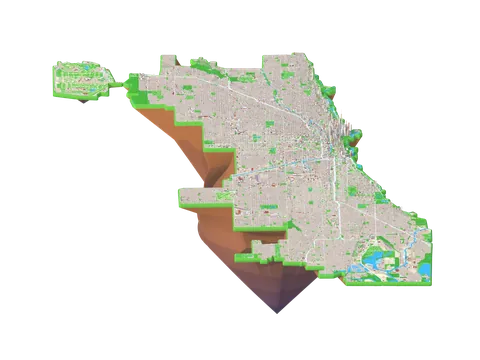 Chicago 48% typical 70% recommended11% nature on foot46,242 runs measured
- 49
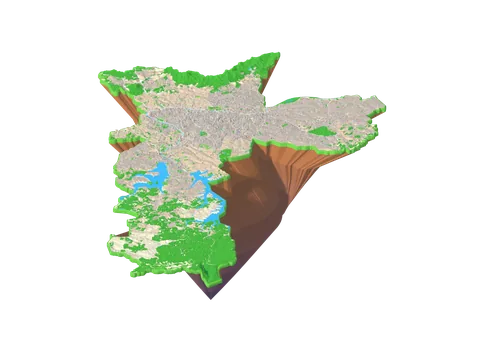 São Paulo 46% typical 61% recommended13% nature on foot96,531 runs measured
- 50
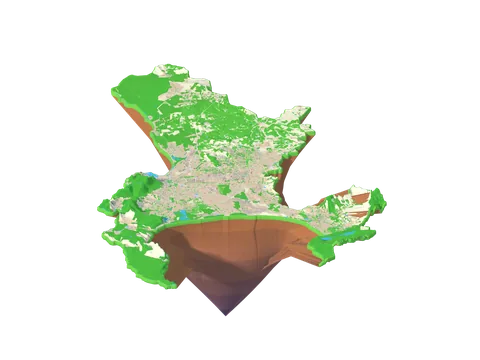 Cape Town 44% typical 52% recommended13% nature on foot3,626 runs measured
- 51
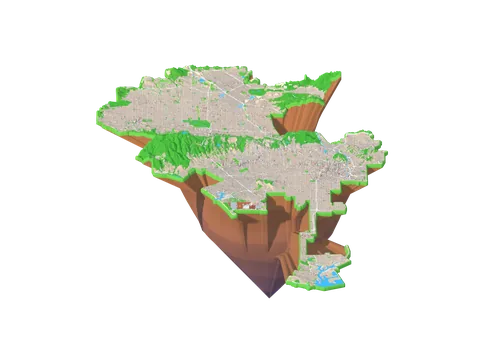 Los Angeles 41% typical 69% recommended9% nature on foot11,406 runs measured
How cities are ranked
Every run is scored from the streets it travels: through nature 30%, views 5%, away from traffic 30%, longest nature stretch 15% and starts near a station 20%. Away from traffic is the share on paths and on roads up to 40 km/h on main roads or 50 km/h on side streets; a pavement counts as the road beside it. Before building anything longer we build one 5.0 km run from every station and start in the city; Typical is the middle score of those, so every part of the city counts once, however many starts we went on to build further from. Recommended is the middle of the runs the city's pages show.
The best cities for cycling
Each city's typical ride, scored the same way everywhere. The tick is the middle city.
- 1 Amsterdam 75% typical 75% recommended70% nature by bike93% low stress36% infrastructure387 rides measured
- 2 Utrecht 64% typical 70% recommended51% nature by bike85% low stress31% infrastructure184 rides measured
- 3 Taipei 63% typical 64% recommended35% nature by bike16% low stress7% infrastructure447 rides measured
- 4 Copenhagen 61% typical 57% recommended37% nature by bike93% low stress28% infrastructure208 rides measured
- 5 Seoul 59% typical 72% recommended24% nature by bike0% low stress7% infrastructure982 rides measured
- 6 Madrid 57% typical 63% recommended44% nature by bike15% low stress6% infrastructure576 rides measured
- 7 Paris 57% typical 57% recommended30% nature by bike66% low stress17% infrastructure149 rides measured
- 8 Edinburgh 55% typical 49% recommended35% nature by bike46% low stress10% infrastructure222 rides measured
- 9 Boston 54% typical 58% recommended25% nature by bike44% low stress10% infrastructure318 rides measured
- 10 Singapore 54% typical 61% recommended25% nature by bike2% low stress14% infrastructure525 rides measured
- 11 Ghent 53% typical 56% recommended33% nature by bike79% low stress22% infrastructure326 rides measured
- 12 Vienna 52% typical 59% recommended30% nature by bike63% low stress19% infrastructure505 rides measured
- 13 Melbourne 52% typical 55% recommended29% nature by bike4% low stress12% infrastructure4,049 rides measured
- 14 Stockholm 52% typical 60% recommended33% nature by bike95% low stress26% infrastructure520 rides measured
- 15 San Francisco 52% typical 61% recommended27% nature by bike74% low stress8% infrastructure268 rides measured
- 16 Barcelona 51% typical 53% recommended40% nature by bike62% low stress12% infrastructure194 rides measured
- 17 Osaka 51% typical 51% recommended20% nature by bike38% low stress3% infrastructure491 rides measured
- 18 Valencia 51% typical 57% recommended28% nature by bike59% low stress14% infrastructure224 rides measured
- 19 Lyon 50% typical 45% recommended22% nature by bike63% low stress18% infrastructure178 rides measured
- 20 Lisbon 50% typical 36% recommended30% nature by bike3% low stress6% infrastructure229 rides measured
- 21 Seattle 50% typical 55% recommended17% nature by bike84% low stress7% infrastructure411 rides measured
- 22 New York 50% typical 64% recommended20% nature by bike44% low stress7% infrastructure859 rides measured
- 23 Munich 50% typical 56% recommended32% nature by bike89% low stress27% infrastructure512 rides measured
- 24 Dublin 49% typical 50% recommended23% nature by bike1% low stress12% infrastructure461 rides measured
- 25 Bristol 49% typical 47% recommended21% nature by bike46% low stress11% infrastructure234 rides measured
- 26 Bogotá 49% typical 54% recommended28% nature by bike1% low stress7% infrastructure806 rides measured
- 27 Toronto 49% typical 49% recommended20% nature by bike16% low stress7% infrastructure523 rides measured
- 28 Manchester 48% typical 42% recommended22% nature by bike21% low stress9% infrastructure277 rides measured
- 29 Berlin 48% typical 54% recommended33% nature by bike61% low stress18% infrastructure1,071 rides measured
- 30 Tokyo 48% typical 52% recommended17% nature by bike38% low stress2% infrastructure937 rides measured
- 31 Hamburg 47% typical 55% recommended28% nature by bike62% low stress17% infrastructure752 rides measured
- 32 Perth 47% typical 54% recommended28% nature by bike1% low stress11% infrastructure2,891 rides measured
- 33 Vancouver 47% typical 45% recommended21% nature by bike64% low stress8% infrastructure294 rides measured
- 34 Brisbane 47% typical 48% recommended29% nature by bike1% low stress11% infrastructure1,194 rides measured
- 35 Sydney 47% typical 51% recommended27% nature by bike2% low stress10% infrastructure2,796 rides measured
- 36 Wellington 47% typical 46% recommended39% nature by bike5% low stress11% infrastructure181 rides measured
- 37 Oslo 46% typical 51% recommended45% nature by bike60% low stress10% infrastructure407 rides measured
- 38 Cologne 46% typical 48% recommended25% nature by bike74% low stress17% infrastructure549 rides measured
- 39 London 46% typical 57% recommended23% nature by bike26% low stress8% infrastructure1,841 rides measured
- 40 Zurich 44% typical 39% recommended30% nature by bike49% low stress10% infrastructure141 rides measured
- 41 Dresden 44% typical 47% recommended34% nature by bike48% low stress8% infrastructure392 rides measured
- 42 San Jose 43% typical 45% recommended11% nature by bike40% low stress10% infrastructure434 rides measured
- 43 Mexico City 42% typical 51% recommended17% nature by bike36% low stress2% infrastructure1,203 rides measured
- 44 Boulder 42% typical 36% recommended20% nature by bike57% low stress22% infrastructure146 rides measured
- 45 São Paulo 42% typical 52% recommended13% nature by bike21% low stress3% infrastructure1,999 rides measured
- 46 Chicago 41% typical 48% recommended11% nature by bike44% low stress5% infrastructure1,144 rides measured
- 47 Portland 41% typical 44% recommended11% nature by bike59% low stress9% infrastructure571 rides measured
- 48 Auckland 41% typical 42% recommended32% nature by bike1% low stress9% infrastructure1,588 rides measured
- 49 Jakarta 38% typical 35% recommended13% nature by bike0% low stress0% infrastructure540 rides measured
- 50 Los Angeles 37% typical 46% recommended10% nature by bike9% low stress4% infrastructure1,327 rides measured
- 51 Cape Town 25% typical 33% recommended13% nature by bike0% low stress1% infrastructure892 rides measured
How cities are ranked
Every ride is scored from the streets it travels: through nature 30%, views 5%, away from traffic 30%, longest nature stretch 15% and climbing 20%. Away from traffic is the share on paths and on roads up to 40 km/h on main roads or 50 km/h on side streets, or kept apart from faster roads by a cycleway, or in a painted lane on a smaller main road up to 50 km/h; a pavement counts as the road beside it. Before building anything longer we build one 20.0 km ride from every station and start in the city; Typical is the middle score of those, so every part of the city counts once, however many starts we went on to build further from. Recommended is the middle of the rides the city's pages show. Climbing is left out when cities are compared: a city's hills are a fact about it, not a mark of how good its rides are. The hilliest cities have their own table.
The best runs
The best run at each distance from each city, 10 at most.
- 1From Amsterdam Science Park Amsterdam 5.4 km 10 m up 97% nature Starts at Amsterdam Science Park station.
- 4 Beckenham Place Park, London3.7 km, 38 m up, 100% through nature
- 5 From Christianshavn, Copenhagen6.8 km, 10 m up, 94% through nature
- 6 Bois de Boulogne, Paris5.7 km, 29 m up, 99% through nature
- 7 From Sognsvann, Oslo4.9 km, 74 m up, 94% through nature
- 8 From Engine Shed, Dublin3.8 km, 47 m up, 100% through nature
- 9 Erknersche Heide, Berlin4.7 km, 27 m up, 100% through nature
- 10 From Stadthausbrücke, Hamburg5.0 km, 71 m up, 88% through nature
- 1From Admiraal Helfrichstraat Amsterdam 10.5 km 5 m up 100% nature Starts at Admiraal Helfrichstraat tram stop.
- 4 From 월드컵경기장, Seoul10.0 km, 133 m up, 98% through nature
- 5 From Uhlandstraße, Hamburg13.5 km, 53 m up, 91% through nature
- 6 From Rådhuset, Stockholm7.2 km, 77 m up, 90% through nature
- 7 Central Park, New York6.9 km, 84 m up, 100% through nature
- 8 From Wanstead, London6.8 km, 23 m up, 100% through nature
- 9 Tempelhofer Feld, Berlin7.4 km, 12 m up, 92% through nature
- 10 Bois de Boulogne, Paris7.8 km, 17 m up, 98% through nature
- 4 From Utrecht Vaartsche Rijn, Utrecht16.2 km, 13 m up, 87% through nature
- 5 From 149th Street–Grand Concourse, New York12.4 km, 146 m up, 80% through nature
- 6 From Montgallet, Paris17.6 km, 87 m up, 86% through nature
- 7 From Ropsten, Stockholm16.3 km, 197 m up, 90% through nature
- 8 From Lübbenauer Weg, Berlin12.5 km, 0 m up, 91% through nature
- 9 From Limehouse, London13.5 km, 23 m up, 99% through nature
- 10 From Fischbek, Hamburg15.3 km, 203 m up, 79% through nature
- 1From Amsterdam Science Park Amsterdam 22.4 km 23 m up 99% nature Starts at Amsterdam Science Park station.
- 4 From IJsselsteinlaan, Utrecht19.5 km, 3 m up, 93% through nature
- 5 Grunewald, Berlin16.3 km, 95 m up, 88% through nature
- 6 From Skarpnäck, Stockholm14.8 km, 232 m up, 92% through nature
- 7 From Invalides, Paris14.1 km, 66 m up, 88% through nature
- 8 From Snippen, Oslo21.1 km, 580 m up, 97% through nature
- 9 From Stadthausbrücke, Hamburg13.8 km, 127 m up, 84% through nature
- 10 Parc Natural de Collserola, Barcelona17.0 km, 772 m up, 96% through nature
How the distances are ranked
Cities are placed on their typical run at the distance: the middle score of every run we built there, recommended or not, so a city where we built more gets no more chances to top the list. Past 5.0 km we build only from the starts that did best at 5.0 km, and cities differ in how many those are, so at the longer distances this compares each city's chosen starts. The run shown is the city's highest scoring one at the distance.
The best rides
The best ride at each distance from each city, 10 at most.
- 4 Amager Vildtreservat, Copenhagen20.0 km, 42 m up, 96% through nature
- 5 From 아차산, Seoul14.6 km, 159 m up, 74% through nature
- 6 Casa de Campo, Madrid21.8 km, 265 m up, 82% through nature
- 7 From Invalides, Paris14.8 km, 23 m up, 76% through nature
- 8 From Willowbrae Gardens, Edinburgh22.0 km, 242 m up, 71% through nature
- 9 From N Harvard St @ Gate 2 Harvard Stadium, Boston18.3 km, 15 m up, 88% through nature
- 10 From Singapore River Cruise, Singapore14.3 km, 92 m up, 86% through nature
- 4 From 역촌, Seoul51.1 km, 658 m up, 76% through nature
- 5 From Liljeholmen, Stockholm51.5 km, 378 m up, 67% through nature
- 6 From San Fermín-Orcasur, Madrid47.9 km, 448 m up, 73% through nature
- 7 From 石牌, Taipei69.6 km, 711 m up, 77% through nature
- 8 From Broad Street & Plymouth Avenue, San Francisco58.5 km, 890 m up, 62% through nature
- 9 From Neuperlach Süd, Munich42.0 km, 78 m up, 53% through nature
- 10 From Mariakerke VISO AHS, Ghent53.4 km, 52 m up, 57% through nature
- 1From Henk Sneevlietweg Amsterdam 102 km 45 m up 87% nature Starts 62 m from Henk Sneevlietweg metro station.
- 4 From Colonia Jardín, Madrid65.1 km, 649 m up, 65% through nature
- 5 From Pilot's Row, San Francisco70.6 km, 887 m up, 73% through nature
- 6 From Vestamager, Copenhagen67.4 km, 170 m up, 45% through nature
- 7 From 慈音山莊, Taipei98.4 km, 742 m up, 72% through nature
- 8 From Singapore Cruise Centre, Singapore78.0 km, 702 m up, 71% through nature
- 9 From Wien Kaiserebersdorf, Vienna105 km, 159 m up, 80% through nature
- 10 From 佃5丁目, Osaka105 km, 443 m up, 68% through nature
How the distances are ranked
Cities are placed on their typical ride at the distance: the middle score of every ride we built there, recommended or not, so a city where we built more gets no more chances to top the list. Past 20.0 km we build only from the starts that did best at 20.0 km, and cities differ in how many those are, so at the longer distances this compares each city's chosen starts. Climbing is left out of that score, so hills neither lift a city nor hold it back. The ride shown is the city's highest scoring one at the distance.
Where each city stands out
Every city's typical route on each part of the score. The tick is the middle city; the city named is the one that does best.
Running
As a table
| City | Through nature | Views | Away from traffic | Longest nature stretch | Starts near a station |
|---|---|---|---|---|---|
| Amsterdam | 78% | 0% | 100% | 47% | 84% |
| Utrecht | 66% | 0% | 100% | 35% | 60% |
| Madrid | 62% | 0% | 91% | 32% | 60% |
| London | 42% | 0% | 99% | 23% | 98% |
| Copenhagen | 58% | 0% | 91% | 32% | 60% |
| Paris | 38% | 0% | 100% | 19% | 100% |
| Oslo | 46% | 0% | 99% | 25% | 60% |
| Dublin | 47% | 0% | 88% | 25% | 85% |
| Berlin | 47% | 0% | 88% | 24% | 85% |
| Hamburg | 49% | 0% | 96% | 25% | 60% |
| Zurich | 43% | 14% | 91% | 23% | 85% |
| Ghent | 48% | 0% | 100% | 23% | 60% |
| Cologne | 38% | 0% | 98% | 24% | 84% |
| Munich | 39% | 0% | 100% | 22% | 84% |
| New York | 34% | 0% | 97% | 18% | 100% |
| Stockholm | 44% | 0% | 100% | 24% | 60% |
| Edinburgh | 51% | 0% | 98% | 26% | 60% |
| Tokyo | 35% | 0% | 91% | 20% | 99% |
| Vienna | 40% | 0% | 94% | 19% | 85% |
| Seoul | 42% | 0% | 97% | 26% | 60% |
| Lyon | 42% | 19% | 98% | 21% | 60% |
| Taipei | 49% | 0% | 90% | 26% | 60% |
| Dresden | 36% | 0% | 95% | 20% | 85% |
| Barcelona | 36% | 12% | 92% | 16% | 60% |
| Bristol | 42% | 0% | 97% | 22% | 60% |
| Boston | 43% | 0% | 97% | 24% | 60% |
| Brisbane | 42% | 0% | 91% | 21% | 60% |
| Toronto | 37% | 0% | 95% | 21% | 60% |
| San Francisco | 33% | 10% | 99% | 18% | 60% |
| Manchester | 40% | 0% | 95% | 20% | 60% |
| Osaka | 36% | 0% | 92% | 19% | 60% |
| Wellington | 47% | 0% | 83% | 28% | 60% |
| Valencia | 43% | 0% | 90% | 22% | 60% |
| Lisbon | 39% | 0% | 91% | 19% | 60% |
| Singapore | 32% | 0% | 100% | 17% | 60% |
| Bogotá | 39% | 0% | 95% | 17% | 60% |
| Melbourne | 39% | 0% | 92% | 19% | 60% |
| Seattle | 29% | 0% | 100% | 16% | 60% |
| Perth | 37% | 0% | 90% | 17% | 60% |
| Sydney | 39% | 0% | 85% | 20% | 60% |
| Mexico City | 22% | 0% | 95% | 11% | 60% |
| Jakarta | 24% | 0% | 80% | 12% | 97% |
| Vancouver | 29% | 0% | 94% | 15% | 60% |
| Auckland | 45% | 0% | 72% | 24% | 60% |
| San Jose | 19% | 0% | 99% | 11% | 60% |
| Boulder | 22% | 0% | 97% | 11% | 60% |
| Portland | 18% | 0% | 99% | 11% | 60% |
| Chicago | 23% | 0% | 90% | 13% | 60% |
| São Paulo | 16% | 0% | 97% | 8% | 59% |
| Cape Town | 32% | 0% | 64% | 18% | 60% |
| Los Angeles | 12% | 0% | 82% | 8% | 59% |
Each part is the middle of the routes measured from every station and start, the same ones the city ranking reads. Climbing is ranked in its own table.
Cycling
As a table
| City | Through nature | Views | Away from traffic | Longest nature stretch |
|---|---|---|---|---|
| Amsterdam | 84% | 0% | 100% | 33% |
| Utrecht | 63% | 0% | 100% | 17% |
| Taipei | 61% | 9% | 93% | 27% |
| Copenhagen | 53% | 5% | 100% | 15% |
| Seoul | 48% | 1% | 96% | 25% |
| Madrid | 51% | 3% | 94% | 16% |
| Paris | 42% | 8% | 99% | 18% |
| Edinburgh | 46% | 2% | 95% | 13% |
| Boston | 46% | 2% | 93% | 17% |
| Singapore | 44% | 5% | 94% | 15% |
| Ghent | 37% | 0% | 98% | 14% |
| Vienna | 35% | 1% | 99% | 11% |
| Melbourne | 40% | 0% | 92% | 13% |
| Stockholm | 32% | 6% | 100% | 9% |
| San Francisco | 30% | 12% | 98% | 13% |
| Barcelona | 33% | 10% | 97% | 11% |
| Osaka | 37% | 0% | 95% | 11% |
| Valencia | 32% | 0% | 98% | 10% |
| Lyon | 28% | 8% | 98% | 11% |
| Lisbon | 38% | 13% | 87% | 10% |
| Seattle | 27% | 6% | 100% | 10% |
| New York | 31% | 0% | 96% | 13% |
| Munich | 28% | 2% | 100% | 9% |
| Dublin | 35% | 0% | 91% | 13% |
| Bristol | 31% | 8% | 95% | 9% |
| Bogotá | 31% | 0% | 97% | 8% |
| Toronto | 33% | 0% | 91% | 14% |
| Manchester | 30% | 0% | 94% | 8% |
| Berlin | 29% | 2% | 95% | 7% |
| Tokyo | 29% | 0% | 95% | 8% |
| Hamburg | 29% | 1% | 95% | 8% |
| Perth | 30% | 0% | 92% | 10% |
| Vancouver | 25% | 0% | 98% | 7% |
| Brisbane | 38% | 0% | 82% | 11% |
| Sydney | 32% | 0% | 89% | 10% |
| Wellington | 41% | 7% | 76% | 15% |
| Oslo | 25% | 4% | 97% | 10% |
| Cologne | 22% | 0% | 98% | 7% |
| London | 26% | 0% | 94% | 7% |
| Zurich | 17% | 9% | 95% | 6% |
| Dresden | 23% | 6% | 91% | 7% |
| San Jose | 14% | 0% | 98% | 6% |
| Mexico City | 14% | 0% | 96% | 4% |
| Boulder | 22% | 0% | 87% | 6% |
| São Paulo | 15% | 0% | 94% | 5% |
| Chicago | 12% | 0% | 97% | 4% |
| Portland | 11% | 0% | 98% | 4% |
| Auckland | 35% | 0% | 66% | 11% |
| Jakarta | 20% | 0% | 77% | 6% |
| Los Angeles | 9% | 0% | 89% | 4% |
| Cape Town | 12% | 0% | 50% | 4% |
Each part is the middle of the routes measured from every station and start, the same ones the city ranking reads. Climbing is ranked in its own table.
What you reach from home
From a residential street in every 500 m square, as far as half the shortest route: 2.5 km on foot, 10.0 km by bike. Each figure is the middle start's.
As a table, and how it is measured
| City | Nature on foot | Nature by bike | Low stress by bike | Cycling infrastructure | Separated | Painted lanes | Starts |
|---|---|---|---|---|---|---|---|
| Amsterdam | 69% (1) | 70% (1) | 93% (3) | 36% (1) | 34% | 4% | 510 |
| Utrecht | 55% (2) | 51% (2) | 85% (5) | 31% (2) | 29% | 3% | 242 |
| Madrid | 51% (3) | 44% (4) | 15% (37) | 6% (42) | 6% | 0% | 1,134 |
| Taipei | 43% (4) | 35% (8) | 16% (36) | 7% (39) | 6% | 1% | 664 |
| Copenhagen | 41% (5) | 37% (7) | 93% (2) | 28% (3) | 27% | 1% | 340 |
| Ghent | 40% (6) | 33% (11) | 79% (7) | 22% (6) | 20% | 5% | 450 |
| Barcelona | 40% (7) | 40% (5) | 62% (14) | 12% (16) | 12% | 0% | 353 |
| Edinburgh | 38% (8) | 35% (9) | 46% (24) | 10% (27) | 9% | 2% | 530 |
| Valencia | 37% (9) | 28% (22) | 59% (19) | 14% (15) | 13% | 0% | 304 |
| Berlin | 36% (10) | 33% (13) | 61% (16) | 18% (9) | 17% | 2% | 2,700 |
| Paris | 35% (11) | 30% (19) | 66% (10) | 17% (11) | 13% | 8% | 393 |
| Wellington | 35% (12) | 39% (6) | 5% (39) | 11% (21) | 10% | 2% | 367 |
| Auckland | 35% (13) | 32% (15) | 1% (48) | 9% (29) | 8% | 2% | 3,689 |
| Oslo | 34% (14) | 45% (3) | 60% (17) | 10% (24) | 9% | 3% | 596 |
| Lisbon | 33% (15) | 30% (17) | 3% (41) | 6% (43) | 6% | 0% | 331 |
| Bogotá | 32% (16) | 28% (25) | 1% (45) | 7% (36) | 7% | 1% | 1,774 |
| Lyon | 32% (17) | 22% (34) | 63% (13) | 18% (10) | 12% | 12% | 203 |
| Vienna | 31% (18) | 30% (16) | 63% (12) | 19% (8) | 18% | 3% | 1,227 |
| San Francisco | 31% (19) | 27% (27) | 74% (8) | 8% (33) | 5% | 7% | 464 |
| Hamburg | 30% (20) | 28% (23) | 62% (15) | 17% (12) | 16% | 2% | 2,002 |
| Munich | 30% (21) | 32% (14) | 89% (4) | 27% (4) | 26% | 1% | 1,053 |
| Melbourne | 29% (22) | 29% (20) | 4% (40) | 12% (17) | 9% | 5% | 11,962 |
| Zurich | 29% (23) | 30% (18) | 49% (21) | 10% (25) | 7% | 5% | 291 |
| Boston | 29% (24) | 25% (28) | 44% (27) | 10% (23) | 7% | 7% | 496 |
| London | 28% (25) | 23% (33) | 26% (32) | 8% (35) | 7% | 1% | 5,252 |
| Sydney | 28% (26) | 27% (26) | 2% (43) | 10% (28) | 9% | 2% | 8,720 |
| Perth | 28% (27) | 28% (24) | 1% (46) | 11% (22) | 9% | 2% | 7,106 |
| Stockholm | 27% (28) | 33% (12) | 95% (1) | 26% (5) | 26% | 1% | 714 |
| Bristol | 27% (29) | 21% (36) | 46% (23) | 11% (20) | 10% | 1% | 398 |
| Brisbane | 27% (30) | 29% (21) | 1% (44) | 11% (19) | 11% | 1% | 8,308 |
| Dublin | 26% (31) | 23% (32) | 1% (47) | 12% (18) | 9% | 5% | 1,660 |
| Singapore | 26% (32) | 25% (29) | 2% (42) | 14% (14) | 14% | 0% | 1,375 |
| Manchester | 25% (33) | 22% (35) | 21% (34) | 9% (31) | 8% | 2% | 461 |
| Seoul | 25% (34) | 24% (31) | 0% (49) | 7% (41) | 6% | 1% | 1,940 |
| New York | 24% (35) | 20% (40) | 44% (25) | 7% (37) | 4% | 6% | 2,887 |
| Dresden | 23% (36) | 34% (10) | 48% (22) | 8% (32) | 7% | 3% | 815 |
| Osaka | 22% (37) | 20% (38) | 38% (30) | 3% (47) | 3% | 0% | 784 |
| Cologne | 22% (38) | 25% (30) | 74% (9) | 17% (13) | 16% | 2% | 1,015 |
| Toronto | 21% (39) | 20% (41) | 16% (35) | 7% (40) | 5% | 3% | 2,151 |
| Seattle | 20% (40) | 17% (43) | 84% (6) | 7% (38) | 6% | 3% | 854 |
| Tokyo | 20% (41) | 17% (44) | 38% (29) | 2% (49) | 1% | 0% | 2,296 |
| Vancouver | 19% (42) | 21% (37) | 64% (11) | 8% (34) | 6% | 4% | 472 |
| Boulder | 19% (43) | 20% (39) | 57% (20) | 22% (7) | 18% | 8% | 245 |
| Mexico City | 15% (44) | 17% (42) | 36% (31) | 2% (48) | 2% | 0% | 3,713 |
| Cape Town | 13% (45) | 13% (46) | 0% (51) | 1% (50) | 1% | 0% | 3,878 |
| São Paulo | 13% (46) | 13% (45) | 21% (33) | 3% (46) | 1% | 3% | 4,510 |
| Jakarta | 13% (47) | 13% (47) | 0% (50) | 0% (51) | 0% | 1% | 2,598 |
| Portland | 12% (48) | 11% (49) | 59% (18) | 9% (30) | 4% | 9% | 1,106 |
| San Jose | 11% (49) | 11% (50) | 40% (28) | 10% (26) | 3% | 14% | 1,367 |
| Chicago | 11% (50) | 11% (48) | 44% (26) | 5% (44) | 4% | 2% | 2,159 |
| Los Angeles | 9% (51) | 10% (51) | 9% (38) | 4% (45) | 2% | 4% | 4,212 |
The number in brackets is the city's rank on that figure, highest first. Nature is the share of what you reach that runs through parks, forests and along water. Low stress is the share of what you can ride that you reach the way most adults are happy to ride: on cycleways, on side streets up to 50 km/h, on main roads up to 40 km/h and in painted lanes on smaller main roads up to 50 km/h. Without lights a road is crossed when it is signed up to 50 km/h with at most 5 lanes, or up to 60 km/h with at most 3. A road split by a median, its two sides' lanes counted together, is crossed at any width up to 40 km/h. A faster or wider road is crossed only at lights. Cycling infrastructure is the separated share plus 50% of the painted lane share: cycleways, bicycle streets, protected tracks and paths shared with walkers that are signed for bikes. A city measured from fewer than 3 starts on foot, or as many by bike, is not ranked.
Districts
| Rank | District | City | Nature on foot | Starts |
|---|---|---|---|---|
| 1 | Kepulauan Seribu | Jakarta | 100% | 31 |
| 2 | Oost | Amsterdam | 82% | 86 |
| 3 | Centrum | Amsterdam | 79% | 33 |
| 4 | Bradbænken | Copenhagen | 77% | 3 |
| 5 | Aotea Great Barrier | Auckland | 77% | 11 |
| 6 | Yerba Buena Island | San Francisco | 75% | 3 |
| 7 | Weesp | Amsterdam | 74% | 37 |
| 8 | West | Amsterdam | 72% | 40 |
| 9 | Roseneath | Wellington | 69% | 4 |
| 10 | Zuid | Amsterdam | 68% | 63 |
| 11 | Noord | Amsterdam | 67% | 99 |
| 12 | Westpoort | Amsterdam | 67% | 5 |
| 13 | Presidio | San Francisco | 66% | 21 |
| 14 | Fisketorvet | Copenhagen | 65% | 9 |
| 15 | Leidsche Rijn | Utrecht | 65% | 36 |
| 16 | Vleuten - De Meern | Utrecht | 64% | 54 |
| 17 | Treasure Island | San Francisco | 64% | 12 |
| 18 | Marka | Oslo | 63% | 25 |
| 19 | Norra innerstadens stadsdelsområde | Stockholm | 63% | 79 |
| 20 | Nieuw-West | Amsterdam | 63% | 89 |
The top 20 districts across every city with at least 3 starts measuring each figure, on foot and by bike.
The hilliest cities
How much the typical route climbs in each city. Hills are not part of how cities are compared above.
| Rank | City | Metres up per km | Runs measured |
|---|---|---|---|
| 1 | Wellington | 33.4 | 8,358 |
| 2 | Oslo | 20.8 | 3,990 |
| 3 | São Paulo | 20.7 | 96,531 |
| 4 | San Francisco | 19.8 | 19,752 |
| 5 | Seattle | 17.5 | 15,526 |
| 6 | Barcelona | 17.2 | 3,199 |
| 7 | Seoul | 15.6 | 7,099 |
| 8 | Lisbon | 14.1 | 8,718 |
| 9 | Lyon | 13.2 | 2,891 |
| 10 | Bristol | 12.8 | 5,639 |
| 11 | Auckland | 12.7 | 22,966 |
| 12 | Sydney | 11.7 | 67,848 |
| 13 | Zurich | 11.5 | 1,887 |
| 14 | Vancouver | 10.1 | 12,940 |
| 15 | Singapore | 9.5 | 6,214 |
| 16 | Stockholm | 9.5 | 5,099 |
| 17 | Madrid | 8.6 | 6,219 |
| 18 | Edinburgh | 8.3 | 7,400 |
| 19 | Brisbane | 8.0 | 4,998 |
| 20 | Dublin | 7.0 | 893 |
| 21 | Mexico City | 7.0 | 3,730 |
| 22 | Boston | 6.6 | 12,857 |
| 23 | Cape Town | 6.6 | 3,626 |
| 24 | Portland | 6.3 | 15,769 |
| 25 | Toronto | 5.9 | 2,829 |
| 26 | Perth | 5.8 | 80,566 |
| 27 | Boulder | 5.3 | 3,168 |
| 28 | Vienna | 5.3 | 5,419 |
| 29 | Melbourne | 5.2 | 57,527 |
| 30 | Paris | 4.2 | 3,752 |
| 31 | Dresden | 4.1 | 3,019 |
| 32 | New York | 4.1 | 4,467 |
| 33 | London | 3.9 | 4,803 |
| 34 | Los Angeles | 3.3 | 11,406 |
| 35 | Manchester | 3.3 | 13,188 |
| 36 | Jakarta | 3.3 | 644 |
| 37 | Bogotá | 3.0 | 20,139 |
| 38 | Tokyo | 2.6 | 4,672 |
| 39 | Hamburg | 2.4 | 3,517 |
| 40 | Taipei | 2.1 | 9,914 |
| 41 | San Jose | 1.8 | 2,925 |
| 42 | Cologne | 1.4 | 1,835 |
| 43 | Munich | 1.4 | 3,778 |
| 44 | Berlin | 1.3 | 6,553 |
| 45 | Copenhagen | 1.3 | 2,864 |
| 46 | Valencia | 1.3 | 7,563 |
| 47 | Ghent | 0.6 | 2,221 |
| 48 | Osaka | 0.5 | 4,989 |
| 49 | Amsterdam | 0.0 | 3,260 |
| 50 | Chicago | 0.0 | 46,242 |
| 51 | Utrecht | 0.0 | 2,699 |
| Rank | City | Metres up per km | Rides measured |
|---|---|---|---|
| 1 | São Paulo | 19.4 | 1,999 |
| 2 | Wellington | 18.3 | 181 |
| 3 | San Francisco | 18.1 | 268 |
| 4 | Oslo | 15.7 | 407 |
| 5 | Seattle | 13.8 | 411 |
| 6 | Lisbon | 13.4 | 229 |
| 7 | Auckland | 11.5 | 1,588 |
| 8 | Lyon | 10.9 | 178 |
| 9 | Barcelona | 10.7 | 194 |
| 10 | Vancouver | 10.4 | 294 |
| 11 | Zurich | 10.3 | 141 |
| 12 | Seoul | 10.2 | 982 |
| 13 | Bristol | 9.9 | 234 |
| 14 | Singapore | 9.4 | 525 |
| 15 | Sydney | 9.3 | 2,796 |
| 16 | Madrid | 9.1 | 576 |
| 17 | Brisbane | 8.6 | 1,194 |
| 18 | Edinburgh | 8.4 | 222 |
| 19 | Dresden | 8.1 | 392 |
| 20 | Stockholm | 7.3 | 520 |
| 21 | Boulder | 6.4 | 146 |
| 22 | Portland | 6.2 | 571 |
| 23 | Perth | 5.8 | 2,891 |
| 24 | Toronto | 5.7 | 523 |
| 25 | Boston | 5.5 | 318 |
| 26 | Dublin | 5.3 | 461 |
| 27 | Mexico City | 5.3 | 1,203 |
| 28 | Melbourne | 5.2 | 4,049 |
| 29 | Paris | 5.0 | 149 |
| 30 | New York | 4.8 | 859 |
| 31 | London | 4.7 | 1,841 |
| 32 | Vienna | 4.5 | 505 |
| 33 | Taipei | 4.4 | 447 |
| 34 | Los Angeles | 4.3 | 1,327 |
| 35 | Manchester | 4.2 | 277 |
| 36 | Bogotá | 4.0 | 806 |
| 37 | Cape Town | 3.7 | 892 |
| 38 | Jakarta | 2.8 | 540 |
| 39 | Hamburg | 2.4 | 752 |
| 40 | San Jose | 2.4 | 434 |
| 41 | Tokyo | 2.2 | 937 |
| 42 | Copenhagen | 1.8 | 208 |
| 43 | Munich | 1.8 | 512 |
| 44 | Cologne | 1.7 | 549 |
| 45 | Berlin | 1.5 | 1,071 |
| 46 | Valencia | 1.4 | 224 |
| 47 | Ghent | 0.8 | 326 |
| 48 | Amsterdam | 0.7 | 387 |
| 49 | Utrecht | 0.7 | 184 |
| 50 | Chicago | 0.6 | 1,144 |
| 51 | Osaka | 0.6 | 491 |
How it is measured
Ranked on the metres climbed per kilometre, the middle of the routes measured from every station and start, the same ones the city ranking reads. Small rises and dips in the elevation data are ignored.
The cities in this edition
- Amsterdam
- Auckland
- Barcelona
- Berlin
- Bogotá
- Boston
- Boulder
- Brisbane
- Bristol
- Cape Town
- Chicago
- Cologne
- Copenhagen
- Dresden
- Dublin
- Edinburgh
- Ghent
- Hamburg
- Jakarta
- Lisbon
- London
- Los Angeles
- Lyon
- Madrid
- Manchester
- Melbourne
- Mexico City
- Munich
- New York
- Osaka
- Oslo
- Paris
- Perth
- Portland
- San Francisco
- San Jose
- São Paulo
- Seattle
- Seoul
- Singapore
- Stockholm
- Sydney
- Taipei
- Tokyo
- Toronto
- Utrecht
- Valencia
- Vancouver
- Vienna
- Wellington
- Zurich
How each city's routes are built and scored is on its own method page, for example Amsterdam's.